

Abstract
The aim of this study was to determine reference equations for the combined measurement of diffusing capacity of the lung for carbon monoxide (CO) and nitric oxide (NO) (DLCONO). In addition, we wanted to appeal for consensus regarding methodology of the measurement including calculation of diffusing capacity of the alveolo-capillary membrane (Dm) and pulmonary capillary volume (Vc).
DLCONOwas measured in 282 healthy individuals aged 18–97 years using the single-breath technique and a breath-hold time of 5 s (true apnoea period). The following values were used: 1) specific conductance of nitric oxide (θNO)=4.5 mLNO·mLblood−1·min−1·mmHg−1; 2) ratio of diffusing capacity of the membrane for NO and CO (DmNO/DmCO)=1.97; and 3) 1/red cell CO conductance (1/θCO)=(1.30+0.0041·mean capillary oxygen pressure)·(14.6/Hb concentration in g·dL−1).
Reference equations were established for the outcomes ofDLCONO, includingDLCOandDLNOand the calculated valuesDmandVc. Independent variables were age, sex, height and age squared.
By providing new reference equations and by appealing for consensus regarding the methodology, we hope to provide a basis for future studies and clinical use of this novel and interesting method.
Abstract
Reference equations for theDLCONOmeasurement based on state-of-the-art methodologyhttp://ow.ly/6VqD30khPEp
Introduction
Marie Krogh[1] developed a method for measuring pulmonary gas exchange in Copenhagen a century ago. Since then, measurement of diffusing capacity of the lung for carbon monoxide (DLCO) has been used in both work-up and monitoring of a wide variety of pulmonary disorders. Since the work of Roughtonand Forster[2] in 1957, the model for transfer of a gas from alveolus to blood has been described as consisting of two resistances in series: where 1/DLis the total resistance for the specific gas in min·mmHg·mLgas−1, 1/Dmis the resistance to passive diffusion through the alveolocapillary membrane and 1/(−b·Vc) represents the resistance of gas uptake of the blood.Dmis the membrane conductance for a given gas (in mLgas·min−1·mmHg−1), θb(blood conductance) is the amount of gas taken up by the blood per mmHg tension (in mLgas·mLblood−1·min−1·mmHg−1) andVcis the pulmonary capillary blood volume (in mL).
Using carbon monoxide (CO) as the inhaled gas, Roughtonand Forstershowed how to determine values forDmandVcby solving the above equation with two unknown variables. The method required measurements ofDLCOat two or more different oxygen (O2) tensions, since an increase in inhaled O2tension results in a decrease in θCOand thereby a decrease in the measuredDLCO[2]. In 1987, Guenardet al.[3] proposed an alternative way of determiningDmandVc, using CO and nitric oxide (NO) in one combined single-breath manoeuvre (DLCONO), making measurements considerably more convenient and possibly also more precise and thereby more suitable for use in clinical work [4]. Using this test, as opposed to the standardDLCOmeasurement, clinicians will obtain more detailed information about the pathoanatomy/pathophysiology underlying a low diffusion capacity, for example, if the defect is related primarily toDmorVc.
In the work of Guenardet al.[3], θNOwas assumed to be infinitely great, since it had been shown earlier that the reaction rate of NO with free haemoglobin (Hb) was 250–1400 times faster than for CO [2,3,5,6]. However, in recent years the correctness of this assumption has been thoroughly debated and recent evidence points towards θNObeing finite, with a value of 4.5 mLNO·mLblood−1·min−1·mmHg−1[7–10]. This value is used in the present study.
其他有争议的问题在这一领域的研究the true value of θCOand the value of α=DmNO/DmCO. In the present study, Forster's [11] 1987 values for θCOmeasured at pH 7.4 are used together with α=1.97. The considerations underlying these choices are presented in the discussion.
To date, a small number of reference values for theDLCONOmethod have been published, but most of these include a rather limited number of subjects (n=10–71) [6]. However, one study included 124 healthy adults with a mean±sdage of ∼40±12 years) [12] and another study population comprised 130 subjects, of which only 17 were aged >60 years [13]. Furthermore, one larger study from 2008 includes 303 healthy adults aged 20–80 years and had a more uniform age distribution [14]. Recently, Zavorskyet al.[15] combined and reanalysed data from these three studies in order to achieve one combined set of reference equations. This procedure has the obvious benefit of reference values relying on a greater number of subjects, but considering a rather wide spectrum in the mean values between these studies, differences in methodology,e.g.breath-hold time, and the limited amount of data obtained from healthy people aged >60 years, there still is an obvious need for an additional larger study to reliably establish reference values for this new test before it can be used in the daily clinical work-up of patients.
Based on state-of-the-art methodology, the aim of this study is to establish new reference values for theDLCONO测量。In that respect, we also wish to achieve consensus regarding methodology of the measurement including calculation ofDmandVc, so that these values can be of clinical use in the future.
Methods
Subjects
A sample of 282 healthy adults aged 18–97 years was recruited between September 11, 2013 and June 18, 2014. They were randomly chosen from the Copenhagen General Population Study, a large general population cohort study including >100 000 participants aged ≥20 years who had been randomly selected from the Danish Civil Registration System. Details about this study have been published previously [16,17]. In addition, participants aged 18–20 years were randomly selected from the Danish Civil Registration System. Subjects were selected in order to achieve a uniform age distribution. Inclusion criteria were age ≥18 years, both parents of European origin, nonsmoker or former use of tobacco <1 pack-year, no known pulmonary or cardiovascular disease, no acute respiratory symptoms 4 weeks prior to investigation, no prior operation or radiation therapy of the chest, body mass index (BMI) <30 kg·m−2and no pregnancy. The subjects lived in Copenhagen or the surrounding area and comprised a socioeconomically heterogeneous group.
Ethics
All participants received written and verbal information about the study and gave their informed consent. The Danish Data Protection Agency and a Danish committee on health research ethics approved the study.
Measurement of diffusing capacities for CO and NO
Measurements ofDLCOandDLNO中同时实现single-breat吗h manoeuvre using Jaeger Masterscreen PFT pro (CareFusion, Hoechberg, Germany). Two identical sets of equipment were used. Before measurement of diffusing capacity, standing height (to nearest 1 mm), weight (to nearest 100 g) and Hb (to nearest 0.1 mmol·L−1) of the participants were obtained. Hb was measured from capillary blood using HemoCue® Hb 201+ (HemoCue, Brønshøj, Denmark). It has been shown that Hb measured from a capillary blood sample closely resembles Hb measured from a venous blood sample taken from the vein of a forearm [18]. In addition, spirometry, body plethysmography and standard single-breathDLCOwere performed in all subjects. Measurements were taken at 20 m above sea level. TheDLCONOtest was performed as follows. After a minimum of 30 min without any form of straining physical activity participants sat down, were equipped with a nose clip, and, after automatic resetting of the device, started tidal breathing through a mouthpiece and filter (SpiroBac; Henrotech, Aartselaar, Belgium) (dead space 56 mL, resistance to flow at 12 L·s−10.9 cmH2O) connected to the pneumotach. After completing a few tidal breaths, subjects were requested to perform a full expiration followed by a rapid full inspiration during which a valve opened allowing them to inspire the test gases. Following that, a breath-hold of 5 s was performed (true apnoea period). The actual breath-hold time was calculated using the Jonesand Meade[19] method and was found to be mean±sd6±0.44 s. The participants then performed a fast expiration, and after aVwashout=0.6 L, aVsample=0.6 L was collected. The procedure was repeated after a 4-min wait. The measurements were considered acceptable if the difference between the two measurements ofDLCOwas <10% or <3 mL·min−1·mmHg−1,建议由美国胸科学会(ATS))/European Respiratory Society (ERS) guidelines [20]. If this was not the case, additional measurements (up to five in total) were performed, until the difference between the highest and second highest measurement ofDLCOmet the requirements. In the vast majority of tests, the repeatability criteria were obtained after only two measurements. From the two chosen measurements, mean values forDLCO,DLNO, diffusion capacity per unit alveolar volume for CO (KCO) and for NO (KNO) andVA(alveolar volume) were calculated. The gas used for the measurements consisted of 0.28% CO, 9.3% helium (He), 20.9% O2and 69.52% nitrogen (N2) (analysis uncertainty ±2.0% relative) (Linde Healthcare/AGA, Copenhagen, Denmark), which was mixed with 400 ppm NO/N2(分析不确定性相对±5.0%)(林德Healthcare/AGA) in an inspiratory bag just before inhalation. The resulting inspired concentrations are presented intable 1. Due to a procedure where the system was flushed with 100% O2to empty any tubes that might contain CO/He/NO gas, the O2concentration was higher in the inspiratory bag than in the initial gas tank. The inert gas, He, was used in the calculation ofVAby means of the He-dilution technique.
Summary of methodology for the two diffusion capacity methods
In our calculations we did not account for NO backpressure, since concentrations of endogenous exhaled NO at rest range between 11 and 66 ppb and therefore were considered negligible compared to our NO measurements, which were in the ppm range [21,22]. In addition, Zavorsky[23] showed that up to 22 repetitions of theDLCONOmeasurement does not lead to a decrease inDLNOvalues. Likewise, he showed that up to 12 repetitions of the test could be performed without significantly loweringDLCOvalues. Therefore, potential accumulation of CO in the blood creating CO backpressure and thereby decreasingDLCOmeasurements were not considered to be a problem in the present study.
In addition, we performed the standardDLCOmeasurement on all subjects. Apart from the methodological differences presented intable 1, the two procedures were performed in the same way.
In order to be able to differentiate between the two methods, outcomes from theDLCONOmeasurement are denoted with “5s” and outcomes from the standardDLCOmeasurement with “10s”,e.g. VA10sforVAmeasured using the standardDLCOmethod.
Quality control
The quality and reproducibility of the measurements were ensured by the following means. Each day the pneumotach was calibrated using the three-flow method with a calibrated 3-L syringe and the apparatus was calibrated for gas fractions using automated procedures for He, CO, O2and methane (CH4). Furthermore, the linearity of the analysers was factory checked. In addition, by using three gases, with different concentrations of CO and NO, linearity was checked before start of the study, in the middle of the study and at its end. Moreover, biological control measurements, in which the same subject performedDLCONOmeasurements on both pieces of equipment in order to detect fluctuations in values, were performed regularly and showed high levels of repeatability. Furthermore, accuracy of theVAmeasurements was checked before start of the study, in the middle of the study and at its end. To our knowledge, no technique has been developed to checkVAobtained during theDLCONOmeasurements. Therefore, the correctness of theVAmeasurements pertaining to the standardDLCOtechnique with CH4as the inert gas was checked both using the Hans Rudolph (Shawnee, KS, USA)DLCOSimulator with EasyLab™ software [24] and using the JQM-syringeDLCOtest, in which aDLCOtest is performed using a 3-L calibration syringe. Important differences to a normalDLCOtest is the fact that the pneumotach is non-heated and that no corrections are made for carbon dioxide or ambient temperature and pressure, saturated with water vapour/body temperature, ambient pressure, saturated with water vapour.VAmeasurements obtained using theDLCOtechnique could later be compared withVAmeasurements pertaining to theDLCONOtechnique.
Both sets of equipment passed all the tests performed.
Calculation ofDm, 1/θCOandVc
As mentioned, we took as our starting point the formula proposed by Roughtonand Forster[2]: According to the most recent knowledge, θNOis considered to be finite with a value of 4.5 mLNO·mLblood−1·min−1·mmHg−1. Thereby the calculation ofDmCOis as follows:
 Where α=DmNO/DmCO=1.97 and k=θNO/θCO. It is important to realise that k is not a constant, since it changes with changes in Hb concentration and mean capillary oxygen pressure (PcapO2) [3,10,25].
When calculating 1/θCO, Forster's [11] 1987 values for θCOmeasured at pH 7.4 were used: Most earlier publications in the field have usedPcapO2=100 mmHg. However, in the present study, the inspiratory fraction of O2was higher than in these studies due to the flushing procedure already described. In order to be able to compare our results with earlier results, we did a correction for O2as follows.
PresumingPcapO2=100 mmHg, at standard Hb concentrations (males 14.6 g·dL−1, females 13.4 g·dL−1) [20], this provides the following values for 1/θCO: males 1.710 mLblood·min·mmHg·mLCO−1, females 1.863 mLblood·min·mmHg·mLCO−1
Vcwas calculated using the following formula: Again, α=DmNO/DmCO=1.97 and k=θNO/θCO.
As mentioned, the choices made in reference to these calculations are considered in more detail in the Discussion.
Correction for O2
Largely, the O2correction was performed as described by Martinotet al.[10]. First,PcapO2was calculated using the following equation: WherePAO2was the alveolar oxygen tension measured in the expired sample andV′O2was the oxygen uptake calculated from the mass balance of oxygen between inspiration and expiration in the manoeuvre. The oxygen fraction measured in the sample volume (mid-expiratory) was assumed to be similar to the oxygen fraction in the residual volume at end-expiration. The diffusion capacity of the lung for oxygen (DLO2) was assumed to be equal toDLCO5s×1.23.
For each subject we then calculated the 1/θCOvalue corresponding to theirPcapO2value and standard Hb. This 1/θCOvalue was used to calculateDmCOandVcin the high O2conditions described. Finally, 1/θCOcorresponding toPcapO2=100 mmHg and standard Hb was calculated, and by rearranging the Roughtonand Forsterequation, this value and the calculated values ofDmCO5sandVcwere used to calculateDLCOcorresponding toPcapO2=100 mmHg. Thereby, theseDLCO5svalues were uncorrected for Hb.
Correction for Hb
Hb-corrected values forDmCOandVc(labelled “Hb-corr”) were found by calculating the 1/θCOvalue corresponding to thePcapO2value and measured Hb of each subject. This 1/θCOHb-corrvalue was then used to calculateDmCOHb-corrandVcHb-corr, as already described.Dmis regarded as being independent of Hb, but when estimatingDmfrom theDLCONOmeasurement, Hb is to be taken into account since the calculation ofDmincludesDLCO, which is dependent on Hb. In order to determineDLCO5sHb-corr, 1/θCOcorresponding toPcapO2=100 mmHg and standard Hb was calculated, and by rearranging the Roughtonand Forsterequation, this value and the calculated values ofDmCOHb-corrandVcHb-corrwere used to calculateDLCO5sHb-corrcorresponding toPcapO2=100 mmHg.
Statistical analyses
For demographics, ANOVA was applied to compare means of continuous variables.
Reference equations were established using stepwise model selection in multiple linear regression analysis according to the Akaike information criterion. Possible explanatory variables were age, age squared, sex and height. For equations intable 3, data were stratified by sex. The stepwise regression analysis was initially performed on the entire dataset. Second, data screening was conducted in two steps and based on the initial models. In step 1 of the data screening, cases with residuals ≥3.0 sdunits above and below the predicted values (individual models for each outcome) were removed. In step 2, the same exclusion criterion was used in the regression analysis based on the reduced datasets. Note that an excluded case for one outcome can be included for the other outcomes. Finally, the stepwise regression analysis was performed on data without outliers. The model selection was unaffected by the data screening, since the initial model selection resulted in the exact same models as the model selection based on data without outliers.
To compare the outcomes according to different breath-hold times, Passing–Bablok regression analyses were performed. 95% confidence intervals were calculated using quantile nested bootstrap resampling.
The residual standard deviation (rsd) expresses the variation from the reference equation, and the predicted value ±1.96×rsdapproximates the 2.5th and 97.5th percentiles.
The plots of the reference equations were stratified by sex and present predicted values according to median height. The median height was based on quantile regression with age as explanatory variable.
All analyses were performed using the statistical software R (version 3.2.0; R Foundation,www.r-project.org).
Results
Baseline characteristics of the study population are presented intable 2. When expressed as % predicted values [26], we found no statistically significant difference in forced expiratory volume in 1 s (FEV1), forced vital capacity (FVC) or FEV1/FVC ratio between females and males.
Characteristics of the study population
The age distribution of the study population is presented infigure 1. As seen, the age distribution was close to uniform and decreased only slightly for ages >85 years.
Age distribution of the study population.
Reference equations for theDLCONOmeasurement are presented intable 3. As seen, after stratification by sex, the independent variables were height, age and age squared, although not all independent variables were included in all equations. The introduction of age squared allows for an accelerated decrease in the dependent variable with increasing age (figure 2aand b).
![a) Diffusing capacity of the lung for carbon monoxide (DLCO) and b) nitric oxide (DLNO) compared to previously published reference equations [12–14]. For each age group, median anthropometric values from our subjects were inserted into the reference equations and the predicted values were depicted as a function of age. Dots represent values measured on each of the subjects. Breath-hold time (true apnoea period) was 5 s in the present study and 5 s in the study by Zavorsky et al. [13], 4 s in the study by Aguilaniu et al. [14] and 10 s in the study by van der Lee et al. [12].](http://www.qdcxjkg.com/content/erj/52/1/1500677/F2.large.jpg?width=800&height=600&carousel=1)
a) Diffusing capacity of the lung for carbon monoxide (DLCO) and b) nitric oxide (DLNO) compared to previously published reference equations [12–14]. For each age group, median anthropometric values from our subjects were inserted into the reference equations and the predicted values were depicted as a function of age. Dots represent values measured on each of the subjects. Breath-hold time (true apnoea period) was 5 s in the present study and 5 s in the study by Zavorskyet al. [13], 4 s in the study by Aguilaniuet al. [14] and 10 s in the study byvan derLeeet al. [12].
Reference equations for the diffusing capacity of the lung for carbon monoxide and nitric oxide
TheDLNO/DLCO5sratio±sdwas found to be 4.4±0.24 and was only marginally dependent on age and height (the latter relationship being nonsignificant). Linear regression analysis with age and height as the only variables showed p=0.00032 with a slope of −0.00251 for age and p=0.058 with a slope of −0.00284 for height (in cm). Adjusted r2=0.0403 (after data screening).
The reference equations forDLCO5sandDLNOwere compared to previously published reference equations for adults (figure 2aand b).
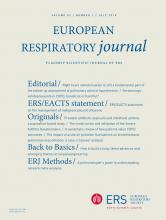
In addition, using Pearson's r and Passing–Bablok regression we comparedDLCO,KCOandVAfrom theDLCONOand standardDLCOmethods, respectively (figure 3a–c). As expected, in all three cases 10-s and 5-s values were strongly correlated with Pearson's r>0.9. However, when using Passing–Bablok regression the 10-s and 5-s methods were shown to be slightly different from each other, since 1 was not included in the 95% confidence interval for slope in any of the three cases. ForVA, Passing–Bablok regression showed thatVA10swas systematically higher thanVA5sby a constant of 0.01, and proportionally higher by a factor of 1.04. In addition, we foundVA10sto be significantly higher with the mean±sdof the difference being 0.28±0.25 L (p<0.01).

Comparison of a) diffusing capacity of the lung for carbon monoxide from the standard 10-s method (DLCO10s) and from the combined method (DLCO5s); b) carbon monoxide transfer coefficient from the standard 10-s method (KCO10s) and from the combined method (KCO5s); and c) alveolar volume from the standard 10-s method (VA10s) and from the combined method (VA5s). Passing–Bablok regressions are shown in the upper left corner of each figure.
平均红细胞比例的总阻力for CO uptake, that is the fraction that 1/(θCO·Vc) constitutes of the total resistance 1/DLCO, was found to be 72.3%. For NO, the corresponding value ((1/(θNO·Vc))/(1/DLNO)) was 39.3%.
In order to examine sex differences in lung structure, regressions were performed forVc/VA5sandDmCO/VA5s(table 4). Both of these ratios were affected by sex, but in opposite directions. That is,Vc/VA5swas generally lower in males than in females whileDmCO/VA5swas higher in males. This suggests that there is a sex difference both in the structure of the alveolocapillary membrane and in the capillary blood volume when normalised toVA.
Reference equations for capillary volume (Vc)/alveolar volume (VA5s) and diffusing capacity of the alveolar membrane for carbon monoxide (DmCO)/VA5s
Agreement between our two sets of equipment was evaluated forDLCO5sandDLNOmeasurements after adjustment for the known independent variables. No significant difference was found.
Discussion
The present study is one of the largest of its kind to present reference equations for the combinedDLCONO测量。特别的主题aged >70 years is unparalleled in earlier studies. In addition, it is first large-scale standalone study performed on a single uniform population to present reference equations forDmCOandVcbased on a finite value of 4.5 mLNO·mLblood−1·min−1·mmHg−1for the conductance of NO (θNO) [7].
Furthermore, apparently we are the first to find a small but statistically significant relationship between theDLNO/DLCOratio and age. This might be a consequence of the relatively large number of older people included in the present study. However, although it is statistically significant, it is worth noting that the change with age is minor, especially compared to the standard deviation of the values. So for clinical purposesDLNO/DLCOcan be regarded as an age-independent variable with a mean value of 4.4.
As mentioned in the Methods section, Hb measurements were performed in all participants, but correction for Hb proved to have no or only minor effect on the overall results. It did not significantly change the mean of any of the main outcomes, apart fromDmCOwhich increased slightly from 100.4 to 101.7 mLCO·min−1·mmHg−1. Nor did the Hb correction improve the adjusted r2for any of the reference equations, and consequently only reference equations for non-Hb corrected values are presented. Our observations on this point are in concordance with those of Stamet al. [30] and Zavorsky[23], the latter finding changes inDLCOof only ∼3%.
Comparison to other reference equations
As seen infigure 2, the reference equations of the present study estimate comparable, but forDLNOsomewhat lower values, to those obtained if using one of the other reference equations for adults [12–15,31]. As described in the Methods section, quality control of measurements was an integrated part of this study and both sets of equipment passed all tests performed. In addition, the fact that no statistically significant difference was found when comparing measurements from the two sets of equipment strengthens our belief that both measured correctly throughout the study.
Of the five reference equations compared infigure 2, Aguilaniuet al. [14] produced the highest predicted values. Several circumstances might work together to explain the difference between their results and the results from the present study. Firstly, Aguilaniuet al. [14] performed their measurements at two different sites (the cities of Grenoble and Bordeaux) and reported significant effects on bothDLCOandDLNO, which were lower in Grenoble than in Bordeaux (mean differences 8.5% and 13.2%, respectively). Infigure 2we have used their equations based on the entire population, which therefore results in higher values than if the Grenoble equations had been used. In addition, although they performed at least two acceptable tests for each subject, apparently Aguilaniuet al. [14] used only values from the test with the greaterDLCO, which differs from the ATS/ERS recommendation, according to which the mean of two acceptable measurements should be reported [20]. In the present study we used the mean of two acceptable measurements, and this difference in procedures contribute to the observed discrepancy between the studies. Other possible explanations of the observed differences might be that different equipment was used, as well as differences in the populations studied. Finally, deviations in the simultaneously measuredVAmight have a rather large impact onDLCOandDLNO. But as Aguilaniuet al. [14] did not present information aboutVA, comparison withVAfrom the present study and its potential influence on the other presented values cannot be made.
As seen infigure 2, only the predicted values from the present study, the study by Aguilaniuet al. [14] and the combined dataset by Zavorskyet al.[15] take into account the observed accelerated loss of diffusing capacity with age. The reason why Zavorskyet al. [13] andvan derLeeet al. [12] have only one slope, when values are fitted for age, might be that the number of old people in their studies have been too low to reliably detect this accelerated change with age. In the case ofvan derLeeet al. [12], the slopes depicted infigure 2are markedly less steep than those from the other studies, which is probably also an effect of the relatively young population in that study. Also notable is the rather high value of 5.1 for theDLNO/DLCOratio found by Zavorskyet al. [13] (current consensus is that the ratio is in the range of 4.3–4.9 [6]; values from present study = 4.4,van derLeeet al. [12]= 4.5 and Aguilaniuet al. [14]= 4.75). If this is not a consequence of actual differences between different study populations, it can result from measures ofDLNObeing too high or measures ofDLCO过低或两者的混合物。我们喜欢think that the first possibility has had the greatest significance, since Zavorskyet al.'s [15] combined values forDLCOfit almost perfectly with the values from the present study. It should be mentioned that methods, equipment and of course study populations were different in all four studies discussed. In relation to differences in study population, it has been shown that differences in physical activity status have an impact on diffusion parameters [31–34]. Likewise, differences in exposure to air pollution might affect lung function. These aspects have not been analysed in the present study, but they might explain some of the observed variation between studies.
DLCONOmethodversusstandardDLCOmethod
As seen infigure 3, some differences can be observed between values obtained from theDLCONOmethod and the standardDLCOmethod.
The largest difference is inVA, withVA5s通常是低于VA10s.In part, this difference might be a result of inadequate mixing of the inert gas with the alveolar gas since short breath-hold times have been shown to lower the measuredVAin some patient groups and in healthy subjects [35–37]. Other important possible reasons for the observed difference are the differences in methodology between the two methods (seetable 1). For example, the inert gas used in the calculation ofVAis not the same (HeversusCH4). The two gases might have different distributions in the lung and different solubility in tissue owing to their physical properties, and this might lead to differences in the measuredVA.
KCOhas been shown to increase with decreasing breath-hold time [37]. When looking atDLCO, this increase inKCOwill tend to counteract the effect of a decreasingVAonDLCO. Indeed, classicallyDLCOis thought to increase with decreasing breath-hold time, which is shown in studies where breath-hold time is the only factor being changed (that is, same methodology in all other aspects) [37,38]. In the present study,KCO5sis generally larger thanKCO10s, as seen infigure 3b. And, as described above, this increase is seen to “compensate” for the decrease inVA, thereby resulting inDLCO5sbeing slightly but significantly larger thanDLCO10s(mean±sddifference=0.85±2.3 mL·min−1·mmHg−1). In summary, as seen intable 1the two methods differ in a number of ways, and more research is needed in order to determine how these differences in methodology influenceVA,KCOandDLCO. What is certain is thatDLCOmeasured using the two different methods cannot be used interchangeably, that is, specific reference material has to be used for each of the two methodologies.
Sex difference inVc/VA,DmCO/VAandDLNO/DLCO5s
BothVc/VAandDmCO/VAwere to some extend affected by sex, although in opposite directions:Vc/VAwas generally slightly higher in females, whileDmCO/VAwas lower. This suggests that there is a sex difference both in the alveolocapillary membrane and in the pulmonary capillary volume when normalised toVA. However, this observed sex difference is affected by the method used for correcting for Hb. This should be kept in mind if subsequent studies are to compare similar results with the results presented here.
In contrast,DLNO/DLCO5sshowed no sex difference. However, it is important to note that theDLCO5svalues used in this calculation were not corrected for Hb. Since Hb is generally lower in females, the resultant values forDLCO5sshould be lower for this reason alone. Therefore, if no sex difference existed between the alveolocapillary membrane and the pulmonary capillary volume when normalised toVA, then we would expectDLNO/DLCO5sto be higher in females than in males, which was not the case in the present study.
DLNO/DLCO
It has been pointed out that theDLNO/DLCOratio might be the best way to assess the relationship betweenDmCOandVc. The main argument has been the former lack of consensus regarding the true values of θCO, θNOand α used in the calculation ofDmCOandVc, since theDLNO/DLCOratio has the advantage of being independent of these values [6]. Certainly, the ratio can tell us something about the relationship betweenDmCOandVc, and in the case of a low measuredDLCOvalue it could point in the direction of the parameter (DmCOorVc) predominantly accountable for the decrease. However, caution should be exercised when looking at the ratio alone, since an apparently normal value could result from bothDLNOandDLCObeing low, and in addition a low ratio could of course either result from a low value ofDLNOor a high value ofDLCO, while the opposite could apply to a high ratio. Furthermore, the scatter of the normal values for the ratio is rather large (mean±sd4.4±0.24), and for patients the scatter of values is also found to be large [39,40]. Obviously, this might result in difficulties differentiating between normal and pathological values. The usage of specific values forDmCOandVccould overcome some of these challenges and in addition it could provide a more detailed view of the resistances associated with lung diffusion. But as mentioned, if this is to become reality, consensus has to be made regarding the calculation ofDmCOandVc. As discussed later, this might be achievable today.
θCO, θNOand α
In recent years, most scientists have agreed that the most correct values for θCOare those presented by Forster[11] in 1987, and thereby not the 1957 values presented by Roughtonand Forster[2]. Forster himself argued that these new values were more correct, particularly since they were measured at a physiological pH of 7.4 and not pH 8.0 like the 1957 values [9,12,14]. In 2016, Guénardet al. [41] tested several of the available 1/θCOversus PcapO2equations by exposing 10 normal subjects to two different inspiratory oxygen concentrations while measuringDLNOandDLCO. Several of the equations managed to keep changes in theDm/Vcratio at a minimum during changes inPcapO2, among these the equation proposed by Forster[11]. On the basis of these results, Guénardet al.also proposed a new “best-fit” equation. This equation is used in the work by Zavorskyet al. [15], since they found that there is still insufficient information to decisively choose between the existing published 1/θCOversus PcapO2equations derivedin vitro. However, it is important to note that very little difference is seen in values forDmandVcwhen comparing this new equation to the equation by Forster. Therefore, in the present study we have decided to continue with thein vitroForsterequation.
Concerning the true value of α, in line with most other researchers we consider the true value to be 1.97, since this is the theoretical value representing the relationship between the physical solubilities of NO and CO in plasma taking into account their molecular weight [3,25]. Some researchers have forced α to higher values in order to achieve a better fit ofDmCOandVcvalues obtained from theDLCONOmethod with values obtained from the oxygen two-step Roughton–ForsterDLCOmethod. For example, in this way Tamhaneet al. [42] foundDLNO/DmCO(two-step)=2.42. An explanation for this might be that in their calculations they used θNO=infinite (thereby assumingDLNO=DmNO) together with the 1957 values for θCO. If instead they had used θNO=finite,DmNOwould not be equal toDLNO, but would exceed this value by ∼70–80% (according to values from the present study and Hughesand Bates[43]). This would lead to an apparentDmNO/DmCO∼4.1–4.3. However, using 1987 values for θCOincreasesDmCOapproximately two-fold compared to the 1957 values, thereby leading to α values that might be better in concordance with the theoretical value of 1.97 [43]. In any case, since α is defined as the physical diffusivity ratio between NO and CO, the approach by Tamhaneet al. [42] cannot be correct.
Much debate has been focused on the correct value of θNO. In 1987, Guenardet al. [3] assumed 1/θNOto be negligible when they first introduced the single-breathDLCONOmeasurement as a possible means of determiningDmCOandVc. Since then, many researchers have regarded θNOas being infinitely great with reference to the very fast reaction rate of NO with free Hb. However, in recent years experimentsin vitroas well asin vivoconducted by Borlandand colleagues [7,44] have consolidated thein vitrovalue of θNO=4.5 mLNO·mLblood−1·min−1·mmHg−1first presented by Carlsenand ComroeJr[45] in 1958. In addition, Borlandand colleagues [7,44] showed that red blood cell lysis in a membrane oxygenator model of CO and NO transfer or substitution of red blood cells with cell-free haem-based oxyglobin in anaesthetised dogs increasedDLNOconsiderably whileDLCOhardly changed. This has led researchers who previously regarded θNOto be infinite to consider it finite with a value of 4.5 mLNO·mLblood−1·min−1·mmHg−1[4,6,39].
According to the work of Roughtonand Forsterfrom 1957 [2], the red blood cell fraction of the total resistance to CO uptake was estimated to be ∼50%. However, newer evidence including morphometric measurements ofDmand re-calculation of values obtained from the oxygen two-step Roughton–ForsterDLCOmethod suggests that this fraction is more likely to be ∼75–80% [43,46]. Some well-known features ofDLCOargue in favour of the view that 1/(θCO·Vc) should be the most important rate-limiting factor for CO transfer: 1) anaemia, increase of carboxyhaemoglobin and/or raising ofPcapO2all lowerDLCO; and 2)DLCOis low in some pulmonary vascular conditions with normal vital capacity [43,47,48]. Values from the present study support this more current view of the distribution of resistances for CO uptake, since the average red blood cell fraction of the total resistance in our study was 72.3%. In addition, the same fraction for NO uptake was 39.3%, which parallels the value of 37% presented by Borlandet al.[7].
Breath-hold time
Another area that needs to be consistent between studies using theDLCONOmeasurement is the breath-hold time. Standard breath-hold time for theDLCOmeasurement is 10 s, but this is not suitable for the combinedDLCONO测量,因为没有传输∼日益加快的4.5倍r than for CO. This leads to very low concentrations of NO after 10 s, which is therefore undetectable by electrochemical cells. Use of a more sensitive chemiluminescent analyser circumvents this problem, but adds considerably to the expense. In the present study we chose a breath-hold time of 5 s (true apnoea period), which is in concordance with earlier studies [13,14,49].
Caution with automated procedures
已经通过使用提供的数据equipment and largely automated procedures. This has some obvious advantages regarding effectiveness and ease of use. However, since we experienced more than one incident where these automated procedures did not comply with our needs and where manual correction of data therefore was needed, we would like to call attention to the fact that caution has to be taken when using such automated procedures.
Clinical implications
To date, several studies have pointed at the added value ofDLCONOcompared to measurement ofDLCOalone when examining patients with different pulmonary disorders. This ranges from pulmonary vascular diseases such as chronic thromboembolic pulmonary hypertension to sarcoidosis and cystic fibrosis [40,50,51]. Unfortunately, a lack of concordance concerning theDLCONOmethod and computation ofDmCOandVccomplicates the interpretation and in particular, comparison of results. As proposed by Hughesandvan derLee[6], a way to circumvent some of these discrepancies is to look mainly at the ratio ofDLNO/DLCO, which according to the studies mentioned shows alterations specific to different pulmonary disorders. However, being able to reliably measureDmCOandVcand by comparing the results between studies and with the updated reference material presented in this study, we hope that future studies will be able to provide more information on the pathoanatomy and pathophysiology of pulmonary disorders. It seems achievable to use information obtained from theDLCONOmeasurement in the everyday clinical work-up of patients.
Conclusion
The present study is one of the largest to date to present reference equations for theDLCONO测量。In particular, subjects >70 years of age are very well represented, which is exceedingly important as an increasing number of patients are in this age group. In addition, it is the first large-scale standalone study performed on a single uniform population to present reference equations forDmCOandVcderived from theDLCONOmeasurement and using current state-of-the-art methodology in the computation of these two measures.
We found age, sex, height and age squared to be independent explanatory variables of the main outcomes. However, the four explanatory variables were not independent predictors of all outcomes. For all outcomes, we found an accelerated loss of capacity with age, which is represented by a negative value of the parameter for the independent variable age squared present in all the reference equations.
We believe that theDLCONOmeasurement and its ability to determineDmCOandVc有巨大的潜力在未来的研究和诊断tics of pulmonary disorders. Yet, in order to reap the full benefits of this technique, in addition to reliable reference equations, consensus concerning methods and computations must be reached. In recent years, much has changed in this field, but finally agreement seems to be within arm's reach. Therefore, we urge future studies to use this newest methodology as it is presented in this article.
Acknowledgement
We thank the bioanalytical technologist in the Department of Clinical Physiology, Nuclear Medicine and PET, Rigshospitalet (Copenhagen, Denmark), for their help in performing the lung function tests.
Footnotes
Conflict of interest: M. Munkholm reports grants from Danish Lung Association, Boehringer Ingelheim, GlaxoSmithKline, Novartis and Alere, and non-financial support from Intra Medic, during the conduct of the study.
Conflict of interest: L. Bjerre-Kristensen reports grants from Danish Lung Association, Boehringer Ingelheim, GlaxoSmithKline, Novartis and Alere, and non-financial support from Intra Medic, during the conduct of the study.
Conflict of interest: F. Madsen reports grants from Allergy and Lung Clinic Helsingør, during the conduct of the study.
Conflict of interest: O.F. Pedersen reports grants from Danish Lung Association, Boehringer Ingelheim, GlaxoSmithKline, Novartis and Alere, and non-financial support from Intra Medic, during the conduct of the study.
Conflict of interest: P. Lange reports grants from Danish Lung Association, Boehringer Ingelheim, GlaxoSmithKline, Novartis and Alere, and non-financial support from Intra Medic, during the conduct of the study.
Conflict of interest: J. Mortensen reports grants from Danish Lung Association, Boehringer Ingelheim, GlaxoSmithKline, Novartis and Alere, and non-financial support from Intra Medic, during the conduct of the study.
Conflict of interest: J.L. Marott reports grants from Danish Lung Association, Boehringer Ingelheim, GlaxoSmithKline, Novartis and Alere, and non-financial support from Intra Medic, during the conduct of the study.
Support statement: This study received financial support from Alere, Boehringer Ingheim, Danmarks Lungeforening, GlaxoSmithKline and Novartis, and nonfinancial support from Intra Medic. Funding information for this article has been deposited with theCrossref Funder Registry.
- ReceivedApril 30, 2015.
- AcceptedMay 19, 2018.
- Copyright ©ERS 2018
References