


-
图1
Schematic representation of analysed cell populations identified during flow cytometric analysis. Hierarchal organisation of all haematopoietic derived CD45+cells of both lymphoid and myeloid lineages. NK: natural killer cells; NKT: natural killer T-cells; PMN: polymorphonuclear neutrophils; Baso: basophils; Eos: eosinophils; Mono: monocytes; Int: intermediate monocytes; Nonclass: nonclassical monocytes; DC: dendritic cells; pDC: plasmacytoid DC; Macs: macrophages. Italic letters (A – P) represent common cell populations, as identified infigure 2。
Overview of gating strategy used in flow cytometric analysis. Analysed populations were first gated to remove cell clumps and debris, and dead cells were removed by viability exclusion. All leukocytes were selected using CD45-positivity and then divided into separate cell populations as shown. FSC-H: forward scatter height; FSC-A: forward scatter area; SSC: side scatter; HLA-DR: human leukocyte antigen – antigen D related; pDCs: plasmacytoid dendritic cells; NK: natural killer cells; NKT: natural killer T-cells. Boxes and italic lettering (A – P) represent common cell populations, as identified infigure 1。
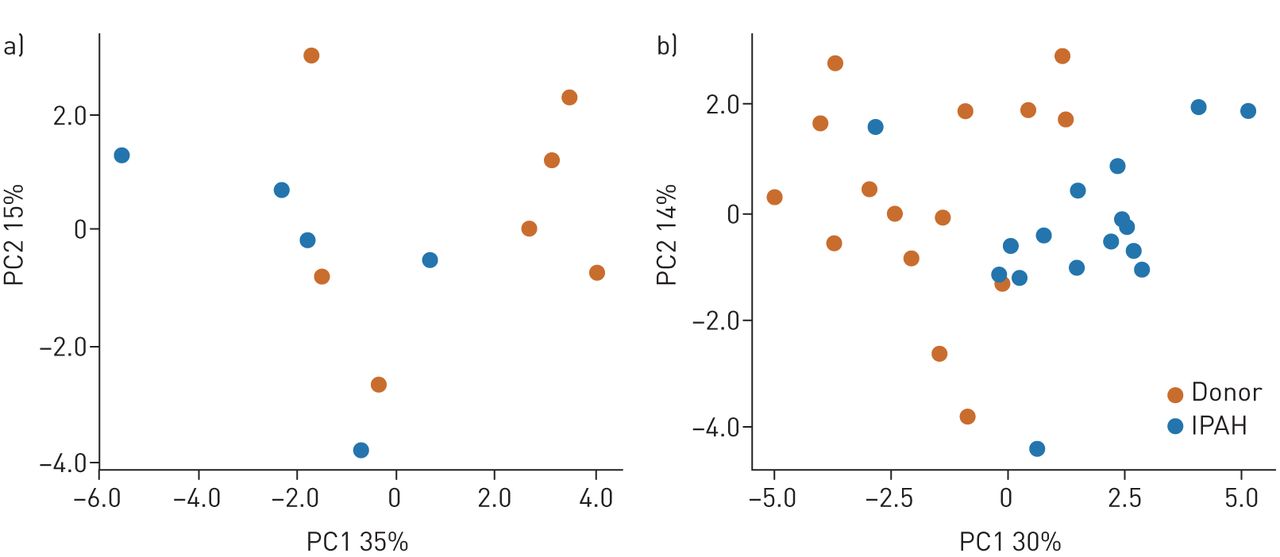
Principal component analysis plots of flow cytometric data separates idiopathic pulmonary arterial hypertension (IPAH) from control samples. The log odds ratios of subset analysis data obtained by flow cytometry using manual gating were used to construct a similarity matrix for the principal component analysis. The first two principal components (PC) with respective percentage variation are depicted. Bivariate plots of dimensionality reduction from a) 12 lungs (seven donor/five IPAH) including 21 cell populations; b) 31 lungs (15 donor/16 IPAH) and 18 cell populations.

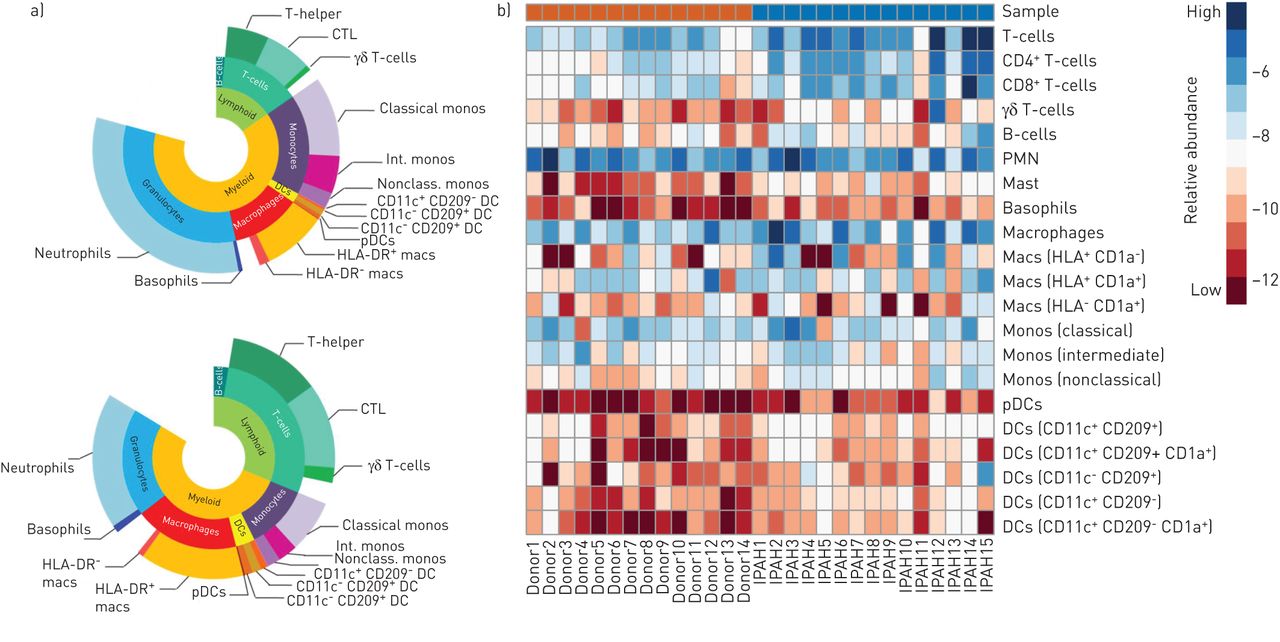
Global changes in inflammatory profiles. a) Sunburst plots showing average distribution of all cell populations in donor lungs and lungs from patients with idiopathic pulmonary arterial hypertension; b) heatmap representation presenting the patient-to-patient variability of the log odds ratio derived from cell number per mg tissue data for 18 individual cell populations. CTL: cytotoxic CD8+T淋巴细胞;PMN:多形核中性粒细胞;Mac:巨噬细胞;monos:单核细胞;INT:中级;非阶级:非分类;DCS:树突状细胞;PDC:浆细胞样DCS。
T-stochastic neighbour embedding (t-SNE) visualisation and regulated cell populations in lung samples. a) t-SNE composite dimension plots of down-sampled and concatenated CD45+带有流式细胞仪数据的细胞,具有覆盖的手动门控细胞群。b)受调节的细胞群在特发性肺动脉高压和供体肺之间差异丰富,流式细胞仪确定。DCS:树突状细胞;PDC:浆细胞样树突状细胞。箱形图显示中位数和四分位数范围。

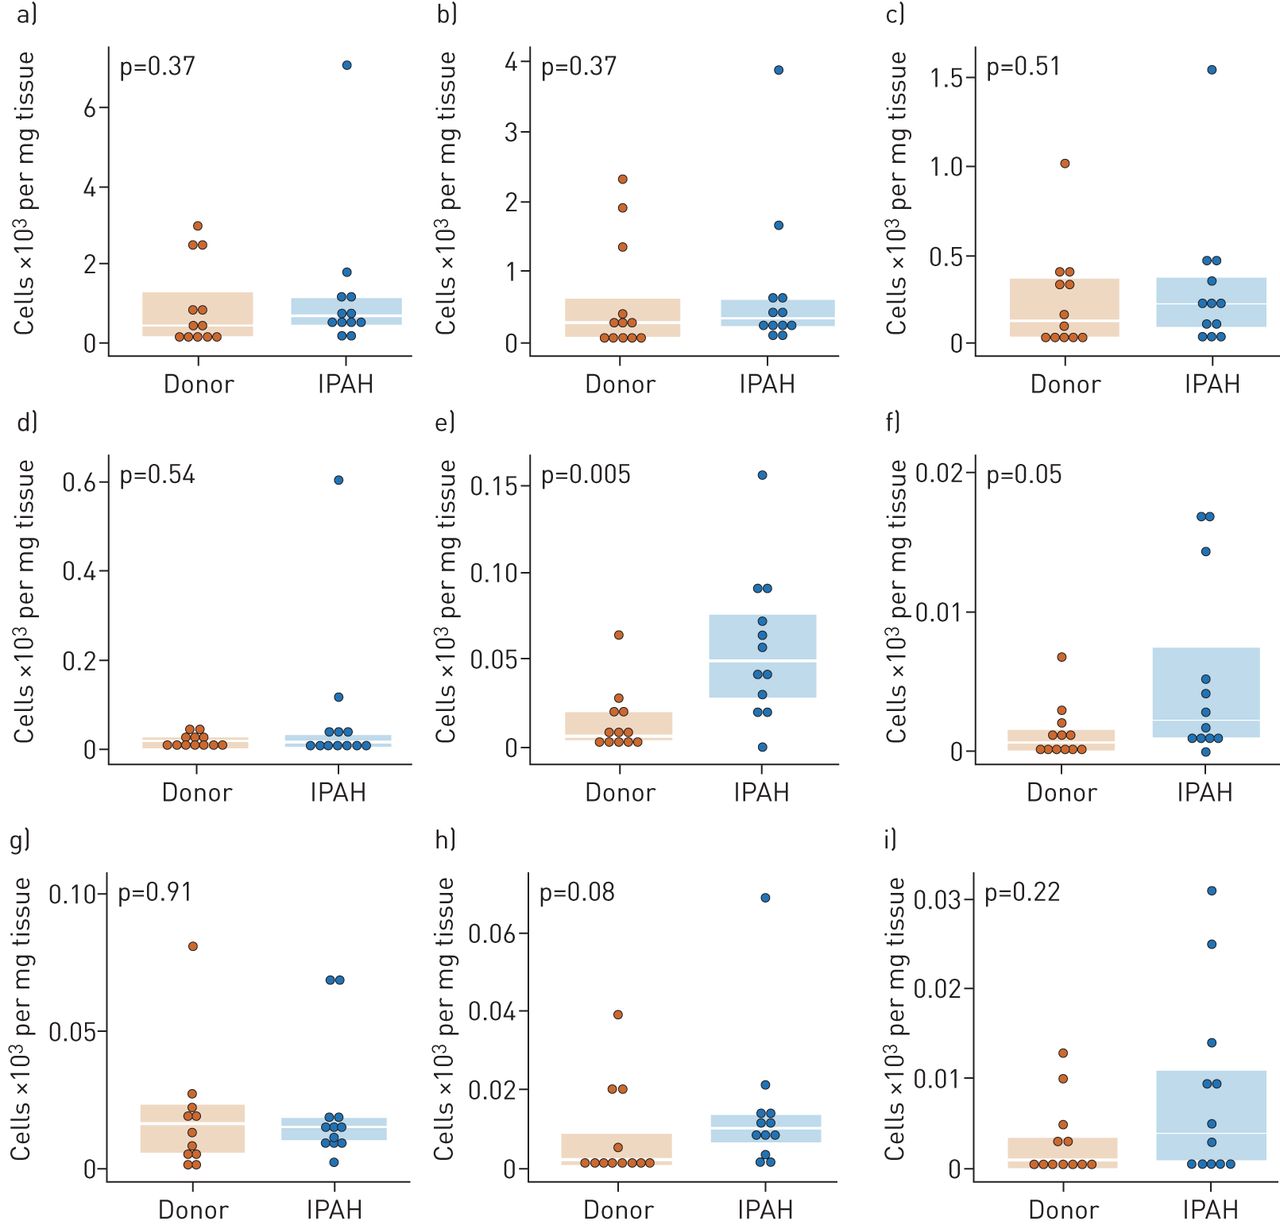
分离的肺动脉中的细胞群体丰度。通过流式细胞术在第三代和第四代肺动脉中测得的多个细胞群(如肺匀浆样品所示)。a)T细胞;B)CD4+T-cells; c) CD8+T-cells; d) γδT-cells; e) mast cells; f) basophils; g) dendritic cells (CD209-CD11c+); h) dendritic cells (CD209-CD11c+CD1a+); i) plasmacytoid dendritic cells. IPAH: idiopathic pulmonary arterial hypertension. Boxplots show median and interquartile range.
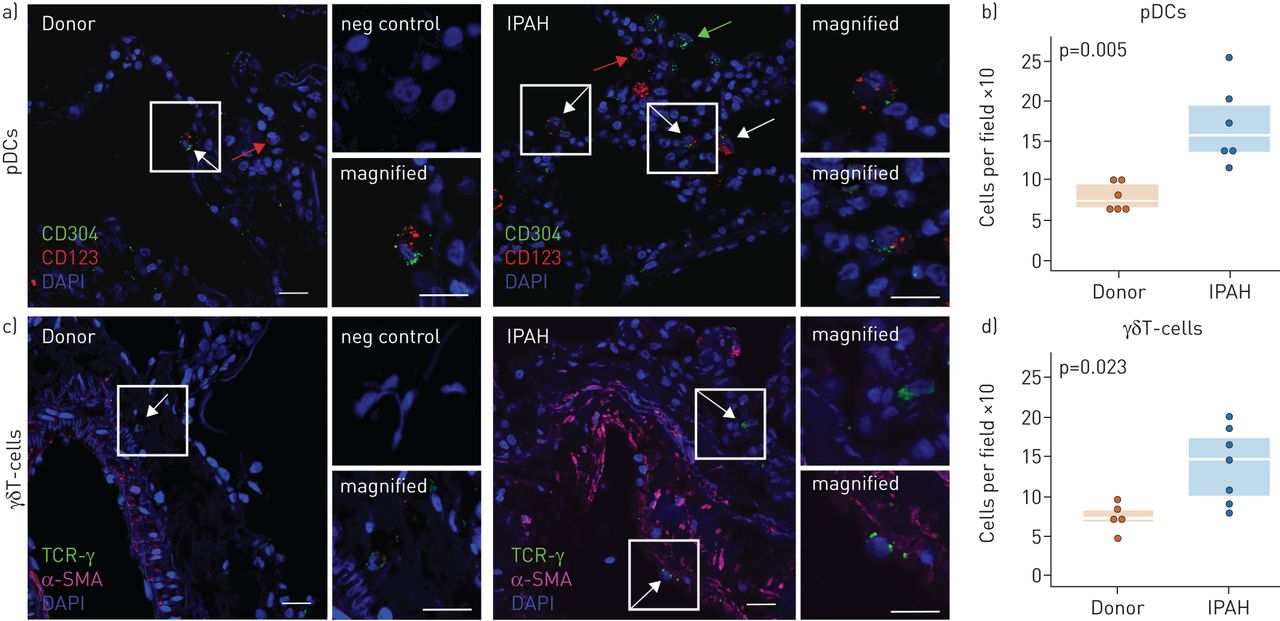
肺中浆细胞类树突状细胞(PDC)和γδT细胞的存在和定位。针对A,B)CD123(RED)和CD304(绿色)(绿色)(CD123+CD304+) and c,d) TCRγ (green) to detect γδT-cells. Smooth muscle actin (SMA) staining is shown in purple; nuclear stainingviaDAPI(蓝色)。较小的面板表示放大区域,如较大面板所示。白色箭头指示感兴趣的细胞,红色和绿色箭头表示单个阳性细胞。负控制:在没有原代抗体的情况下进行染色。比例尺= 20 µm。
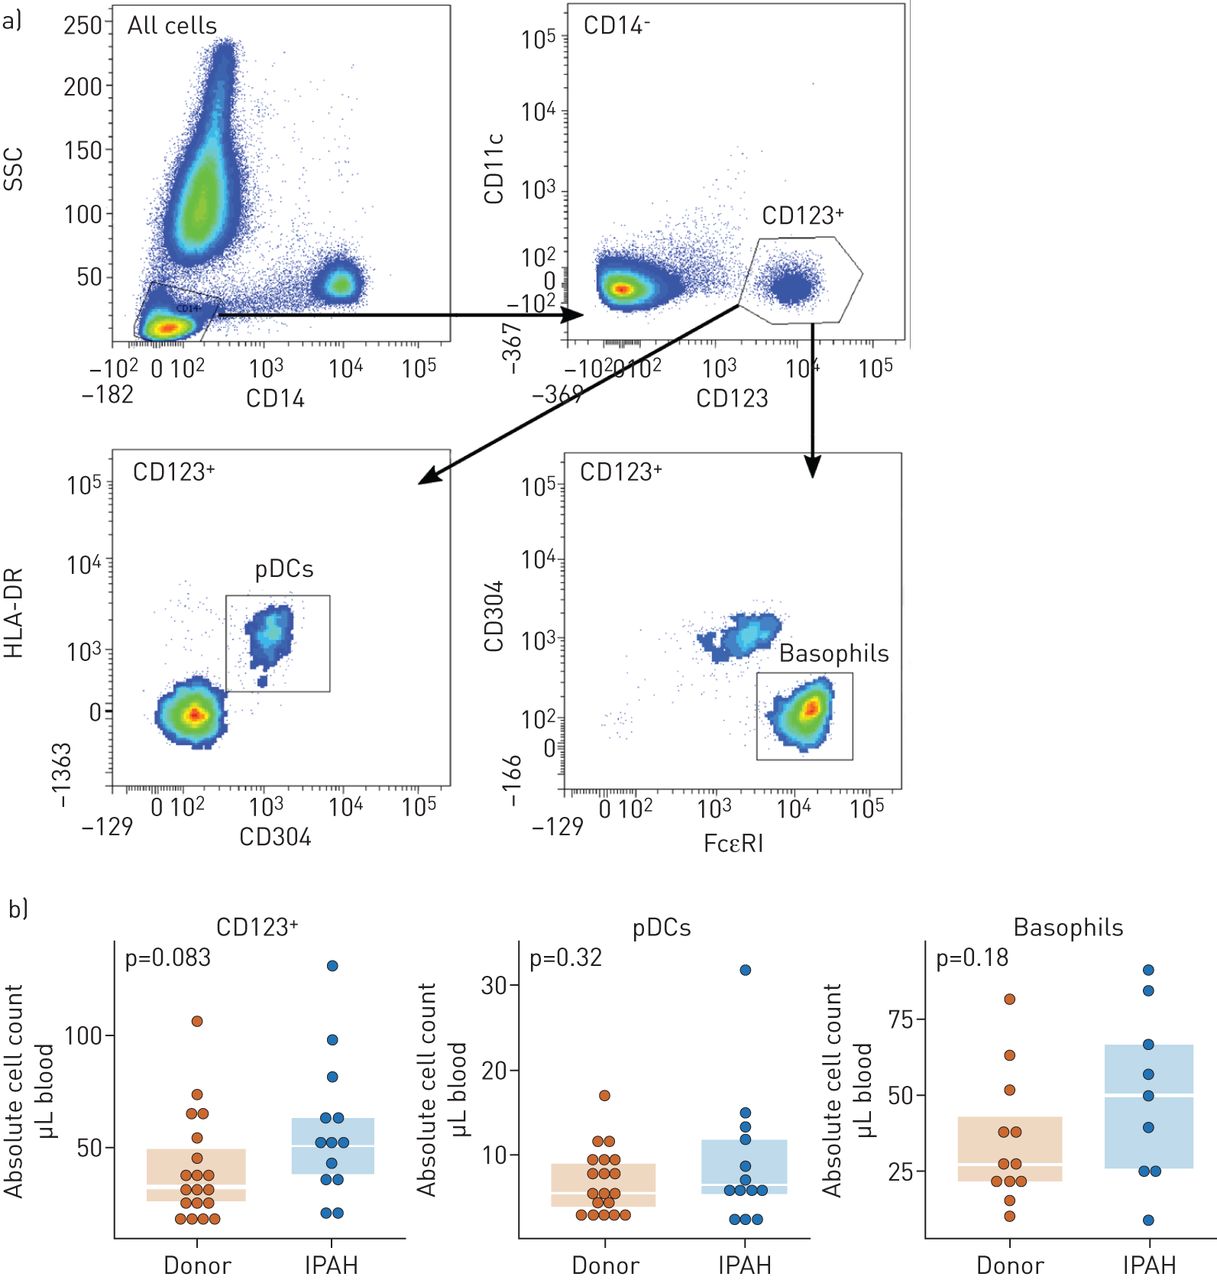
Idiopathic pulmonary arterial hypertension (IPAH) patients do not possess elevated plasmacytoid dendritic cell (pDC) numbers in the peripheral blood. a) Gating strategy for the flow cytometric quantification of circulating pDCs (CD14−CD11c−CD123+CD304+HLR-DR+) and basophils (CD14−CD11c−CD123+CD304−FceRi+) in peripheral blood. b) Scatterplot and boxplot overlays of quantified total CD11c−CD123+cells, pDCs and basophils. Boxplots show median and interquartile range.
-
表1
Clinical characteristics of the donors and idiopathic pulmonary arterial hypertension (IPAH) patients
捐助者 IPAH patients 肺样本 15 16 Age years 41.7±13.2 34.1±10.6 男性/女性 10/5 5/11 高度厘米 175±9 170±8 重量公斤 73.6±9.9 61.2±13.3* MPAP MMHG 71.2±16.6 pvr dyn·sec·cm−5 1845±669 6MWD m 280±187 NYHA class III–IV NT-PROBNP PG·ML−1 4412±2445 CRP MG·DL−1 1.2±2.4 PAH targeted therapy ERA 1 ERA+PDE5i 1 sGCs+PGI 1 PDE5i+PGI 4 ERA+PDE5i+PGI 7 PDE5i+PGI+CCB 1 Unknown 1 Data are presented as n or mean±sd。MPAP:平均肺动脉压;PVR:肺血管抗性;6MWD:步行6分钟;NYHA:纽约心脏协会;NT-Probnp:N末端脑力尿素肽;CRP:C反应蛋白;时代:内皮素受体拮抗剂;PDE5I:5型磷酸二酯酶抑制剂;SGCS:可溶性鸟苷酸环化酶刺激剂; PGI: prostacyclin analogue; CCB: calcium channel blocker. *: p≤0.05.
-
补充材料
Please note:补充材料未由编辑办公室编辑,并且在作者提供的那样上传。
Figure S1. Pulmonary arterial isolation procedure. Pulmonary arteries(*) were identified under a stereomicroscope due to their close vicinity to airways(§). Arteries were exposed by gradual removal of lung tissue until ~1-2cm of artery was visible. The artery was then removed en-bloc including side branches and forwarded to cell isolation. Scale bar represents 1 cm.ERJ-01214-2017_FIGURE_S1
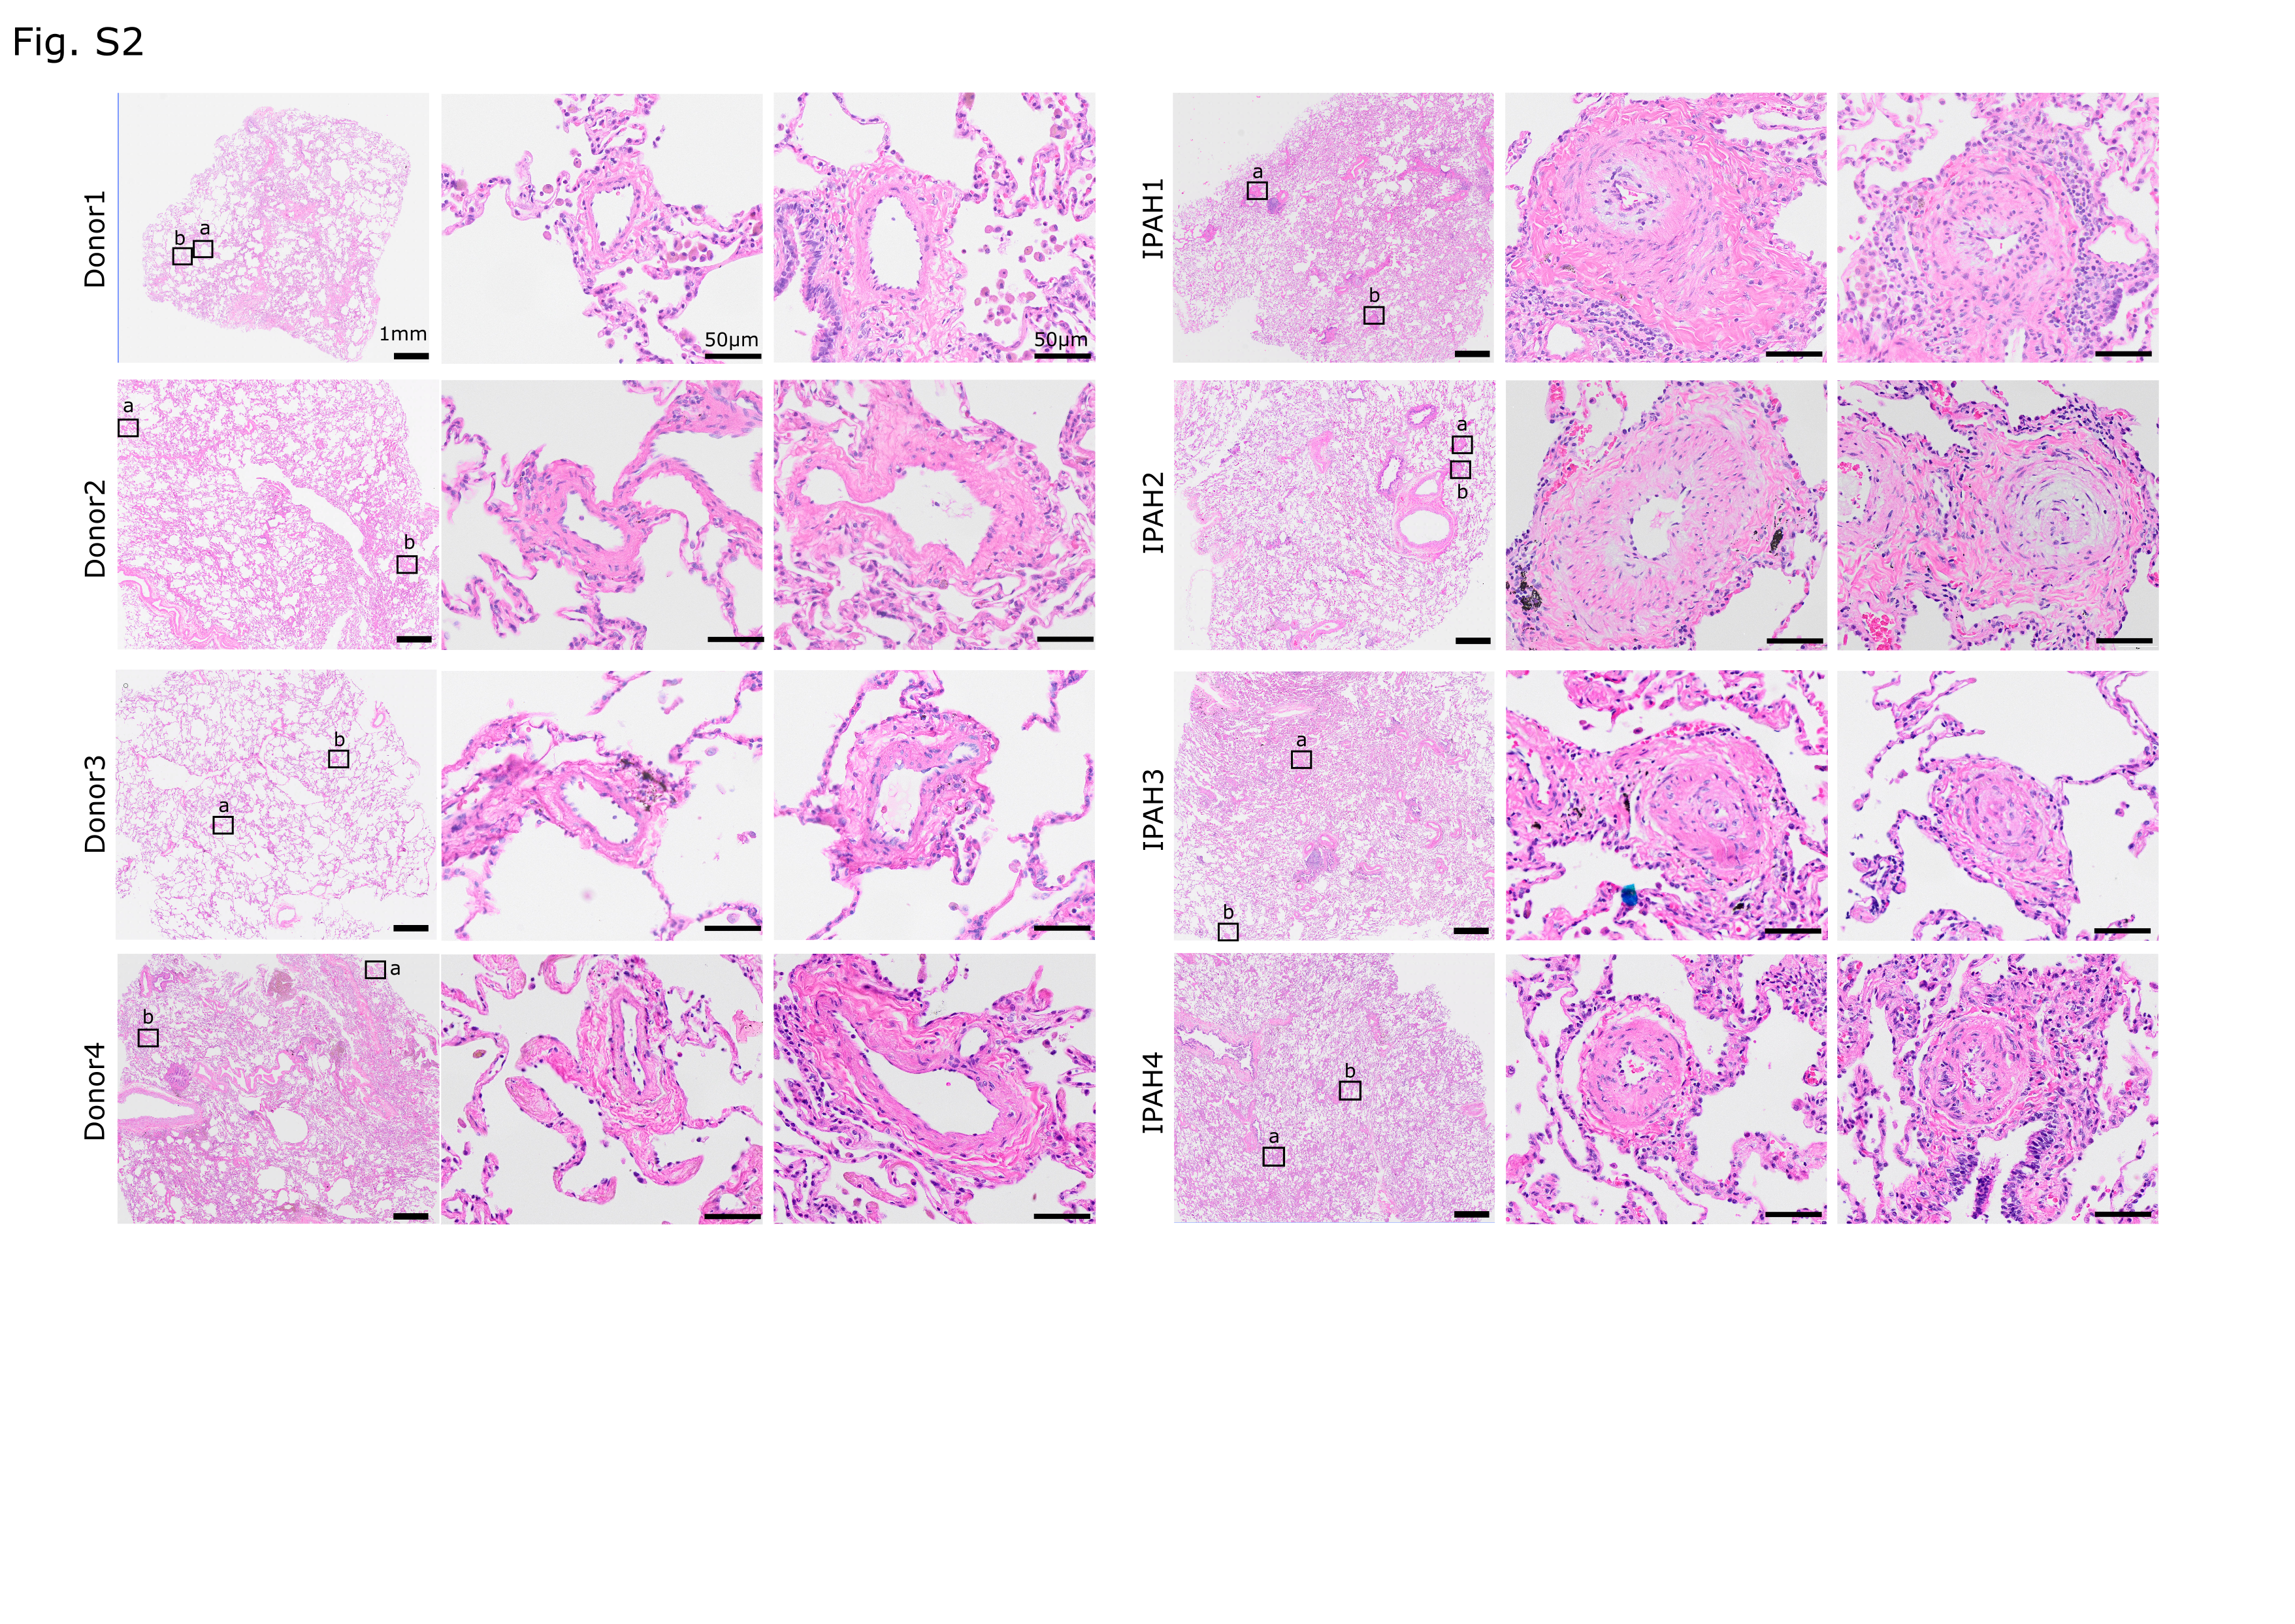
Figure S2. Lung morphology in donor and IPAH samples. Representative images of sections derived from explanted lung samples (n=4). Magnified areas containing pulmonary vessels are also shown.ERJ-01214-2017_FIGURE_S2
图S3。在不同的流式细胞仪面板中测量的细胞群的相关图。a)总CD45+细胞,b)PMN:多形核中性粒细胞,c)CD3+ T细胞,d)Mac:巨噬细胞和E)肥大细胞。对于每个相关性,显示了从Spearman的等级相关性得出的P值和RHO(R)估计值。ERJ-01214-2017_FIGURE_S3
Figure S4. Correlation analysis of individual cell populations in matched lung samples. Analysed cell populations in the two separate pieces of lung were compared by Spearman's rank correlation. P values and rho (r) estimates derived from Spearman's rank correlation are shown.ERJ-01214-2017_FIGURE_S4
Figure S5. Abundance of cell populations excluded from global principal component analysis. Scatterplot and boxplot overlays of cell populations in IPAH and donor lungs as analysed by flow cytometry. NK, natural killer cells; NKT, natural killer T cells. Boxplots show median and interquartile range.ERJ-01214-2017_FIGURE_S5
Figure S6. Patient-to-patient variability in CD45+ cell populations. Heatmap representation presenting the patient-to-patient variability of the log odds ratio derived from the percentage CD45+ data for 18 individual cell populations. Blue colours indicate highest abundance, red lowest for a single cell type. PMN, polymorphonuclear neutrophils; Macs, Macrophages; Monos, monocytes; DC, dendritic cells; pDC, plasmacytoid DC; gd gamma delta.ERJ-01214-2017_FIGURE_S6
Figure S7. Euclidean clustering of individual IPAH and donor samples. Heatmap representation using Euclidean clustering of the log odds ratio derived from number of cells per mg tissue data for the 21 individual cell populations. Blue colours indicate highest abundance, red lowest for a single cell type. Monos, monocytes; DC dendritic cells, Macs, Macrophages; CTL, cytotoxic T cell; gd gamma delta; PMN, polymorphonuclear neutrophils.ERJ-01214-2017_FIGURE_S7
Figure S8. Abundance of remaining cell population in lung samples. Abundance of cell populations not included in图4如通过对IPAH和供体肺的流式细胞术分析确定。DC,树突状细胞;PMN,多形核中性粒细胞。框图显示中位数和四分位间范围,组之间的统计显着性是由Wilcoxon等级总和测试确定的。ERJ-01214-2017_FIGURE_S8
Figure S9. Relative proportions of CD45+ cells in lung samples. The relative proportions of multiple cell populations in IPAH and donor lungs. DC, dendritic cells; pDC; plasmacytoid dendritic cells; PMN, polymorphonuclear neutrophils. Boxplots show median and interquartile range, statistical significance between groups was determined by the Wilcoxon rank sum test.ERJ-01214-2017_FIGURE_S9
图S10。分离的肺动脉中的细胞群丰度。剩余的细胞群不包括图5以在IPAH流仪分析d donor samples. DC, dendritic cells; PMN, polymorphonuclear neutrophils. Boxplots show median and interquartile range, statistical significance between groups was determined by the Wilcoxon rank sum test.ERJ-01214-2017_FIGURE_S10
-
补充材料
V. ForisERJ-01214-2017_Foris
G. KwapiszewskaERJ-01214-2017_Kwapiszewska
A. OlschewskiERJ-01214-2017_Olschewski_A
H. OlschewskiERJ-01214-2017_Olschewski_H


