


Figures
-
" data-icon-position="" data-hide-link-title="0">
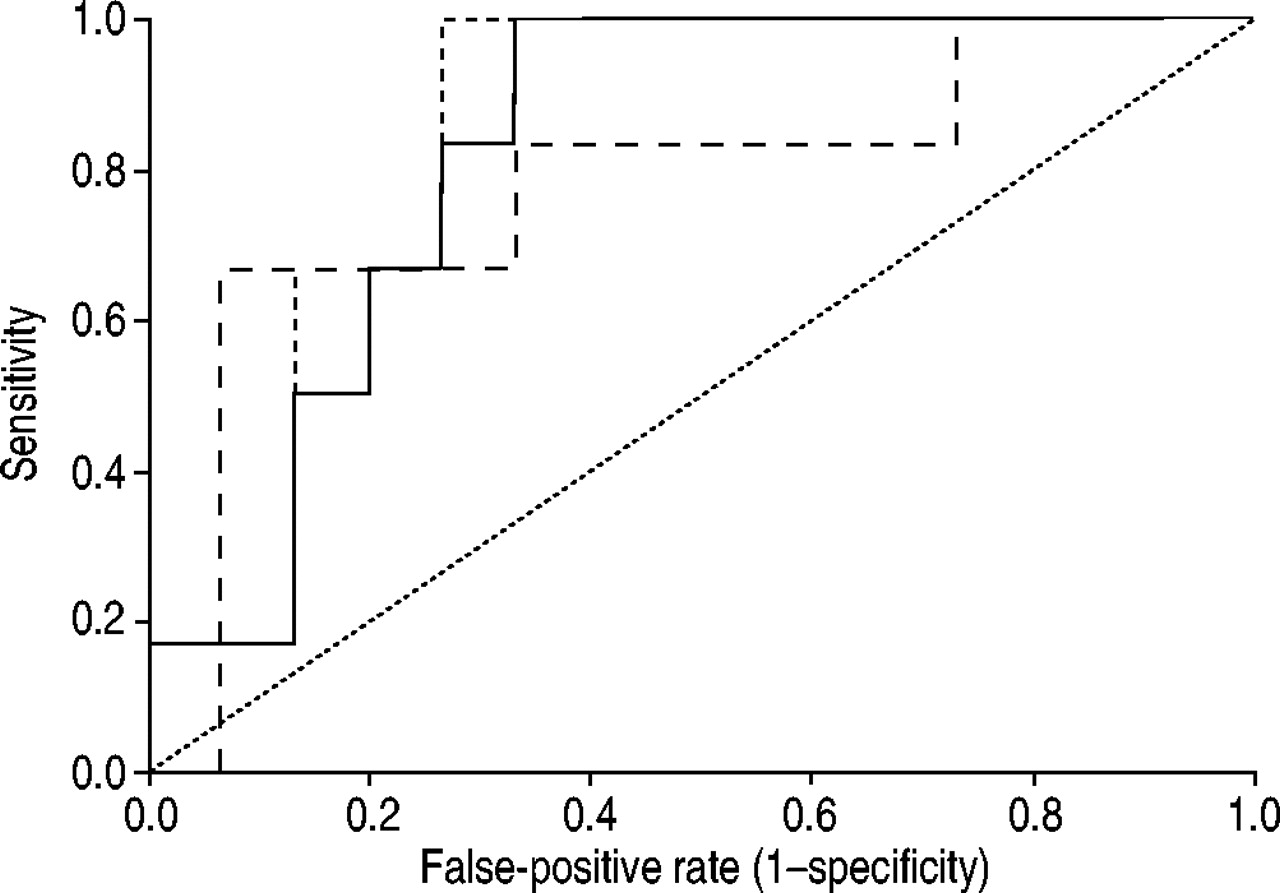
 Fig. 1—
Receiver-operating characteristic curve comparing baseline arterial oxygen tension (Pa,O2;___), baseline forced expiratory volume in one second (% pred; ----) and the result of the hypoxia inhalation test (Pa,O2after inhalation of a gas mixture with an inspiratory oxygen fraction of 0.15 for 15 min; – – – ) for the prediction of mountainPa,O2on arrival (cut-off 6.6 kPa (50 mmHg); …: reference line).


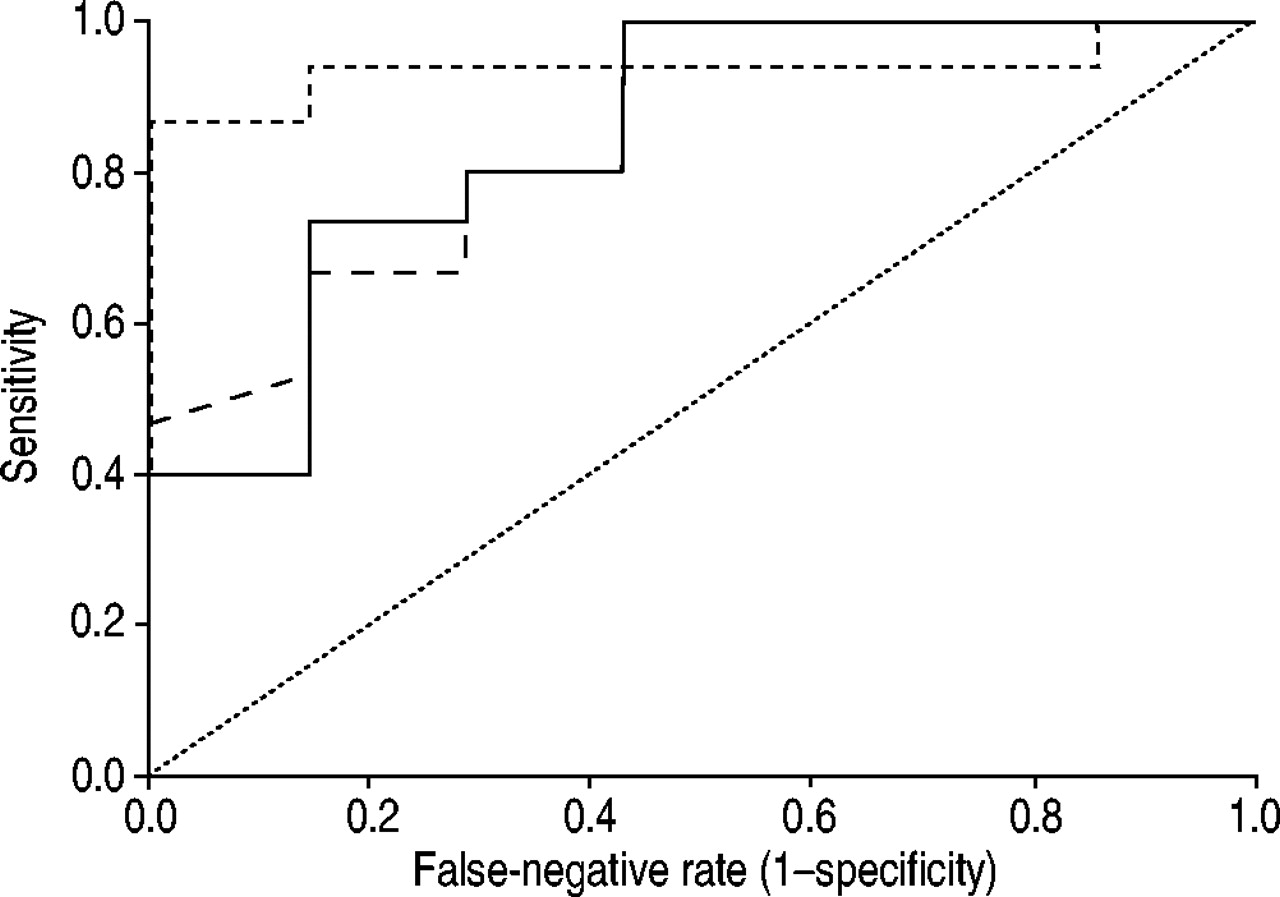
Receiver-operating characteristic curve comparing baseline arterial oxygen tension (Pa,O2;___), baseline forced expiratory volume in one second (% pred; ----) and the result of the hypoxia inhalation test (Pa,O2after inhalation of a gas mixture with an inspiratory oxygen fraction of 0.15 for 15 min; – – – ) for the prediction of mountainPa,O2during moderate exercise (cut-off 6.6 kPa (50 mmHg); …: reference line).
Tables
-
Table. 1—
Respiratory parameters at baseline#and after 1 h at an altitude of 2,650 m
Baseline 2,650 m p-value FEV1% pred 66 (26–107) 69 (30–115) <0.001 FVC % pred 85 (51–108) 88 (47–119) 0.02 Tiffeneau index¶ 65.7 (34.0–89.0) 68.0 (44.0–86.0) 0.001 PEF % pred 72 (24–112) 88 (42–132) <0.001 MEF25% pred 19 (0–75) 28 (8–76) <0.001 RawkPa·s−1·L−1 0.4 (0.1–1.1) 0.32 (0.16–1.10) 0.009 ITGV % pred 117 (63–196) 132 (70–194) <0.001 TLC % pred 105 (66–131) 109 (66–142) 0.032 RV % pred 152 (79–286) 188 (68–341) 0.14 Pa,O2kPa 9.8 (8.0–13.0) 7.0 (5.3–10.5) <0.001 Pa,CO2kPa 5.1 (4.4–6.0) 4.7 (3.7–6.0) <0.001 Sa,O2% 95 (89–99) 90 (66–98) <0.001 Pulse rate 83 (66–110) 84 (66–118) 0.059 Data are presented as median (range), unless otherwise stated. FEV1: forced expiratory volume in one second; FVC: forced vital capacity; PEF: peak expiratory flow; MEF25: maximal expiratory flow when 25% of the FVC remains to be exhaled;Raw: airway resistance; ITGV: intrathoracic gas volume; TLC: total lung capacity; RV: residual volume;Pa,O2: arterial oxygen tension;Pa,CO2: arterial carbon dioxide tension;Sa,O2: arterial oxygen saturation; % pred: percentage of the predicted value.#: (530 m above sea level);¶: FEV1/FVC.
-
Table. 2—
Blood gas levels and oxygen saturation at 2,650 m after 7 h at rest and 5 min exercise at 30 W
Subjects n 7 h at rest 5 min exercise p-value Pa,O2kPa 35 6.9 (5.3–9.6) 6.3 (4.4–9.2) <0.001 Pa,CO2kPa 35 4.5 (2.9–5.9) 4.5 (3.5–5.9) 0.45 Sa,O2% 36 90 (80–98) 86 (56–93) <0.001 Data are presented as median (range), unless otherwise stated. For technical reasons, one exercise measurement could not be used.Pa,O2: arterial oxygen tension;Pa,CO2: arterial carbon dioxide tension;Sa,O2: arterial oxygen saturation.
-
Table. 3—
Hypoxia inhalation test: blood gas levels and oxygen saturation at 530 m before and after inhalation of 15% oxygen for 15 min
Subjects n Before After p-value Pa,O2kPa 23 9.6 (7.4–12.0) 6.9 (5.5–8.2) <0.001 Pa,CO2kPa 23 4.9 (4.1–6.0) 5.0 (3.7–5.6) 0.03 Sa,O2% 23 95 (88–98) 89 (82–94) <0.001 Data are presented as median (range), unless otherwise stated.Pa,O2: arterial oxygen tension;Pa,CO2: arterial carbon dioxide tension;Sa,O2: arterial oxygen saturation.
-
Table. 4—
Comparison of different baseline parameters for the prediction of an arterial oxygen tension (Pa,O2) at altitude of <6.6 kPa at rest using receiver-operating characteristic curves#
AUC 95% CI Cut-off value False-positive rate % p-value MEF75% pred 0.91 0.79–1.01 <31 9 0.01 FEV1% pred 0.89 0.77–1.01 <48 9 0.01 Tiffeneau index¶ 0.89 0.76–1.10 <56 9 0.01 MEF25% pred 0.84 0.70–0.98 <13.5 17 0.004 Pa,O2baseline kPa 0.86 0.71–1.00 <9.5 23 0.004 Sa,O2baseline % 0.85 0.71–1.00 <94 28 0.03 Pa,O2after HIT kPa 0.80 0.58–1.00 <6.8 33 0.02 The cut-off values and false-positive rates correspond to a sensitivity of ≥75%. AUC: area under curve; CI: confidence interval; MEF75: maximal expiratory flow when 75% of the forced vital capacity (FVC) remains to be exhaled; FEV1: forced expiratory volume in one second; MEF25: maximal expiratory flow when 25% of the FVC remains to be exhaled;Sa,O2: arterial oxygen saturation; HIT: hypoxia inhalation test; % pred: percentage of the predicted value.#: the greater the AUC the better the predictive value of the baseline parameter (see fig. 1⇑); for example, in the present population, six of 36 (sensitivity 84%) patients with an FEV1of <48% pred showed restingPa,O2at altitude of <6.6 kPa, whereas three of 36 patients (8.6%) showedPa,O2of >6.6 kPa;¶; FEV1/FVC.
-
Table. 5—
Comparison of different baseline parameters for the prediction of an arterial oxygen tension (Pa,O2) at altitude of <6.6 kPa during moderate exercise using receiver-operating characteristic curves#
AUC 95% CI Cut-off value False-positive rate % p-value MEF75% pred 0.93 0.82–1.04 <58 8 0.001 FEV1% pred 0.93 0.82–1.04 <67 14 0.001 MEF25% pred 0.91 0.78–1.04 <19 25 0.002 Tiffeneau index¶ 0.90 0.77–1.03 <66 17 0.003 Pa,O2after HIT kPa 0.85 0.68–1.02 <7.1 28 0.009 Pa,O2baseline kPa 0.85 0.66–1.03 <9.9 12 0.01 Sa,O2baseline % 0.76 0.59 - -0.93 <96 33 0.016 The cut-off values and false-positive rates correspond to a sensitivity of ≥75%. AUC: area under curve; CI: confidence interval; MEF75: maximal expiratory flow when 75% of the forced vital capacity (FVC) remains to be exhaled; FEV1: forced expiratory volume in one second; MEF25: maximal expiratory flow when 25% of the FVC remains to be exhaled; HIT: hypoxia inhalation test;Sa,O2: arterial oxygen saturation; % pred: percentage of the predicted value.#: the greater the AUC the better the predictive value of the baseline parameter (see fig. 2⇑);¶: FEV1/FVC.


