


Abstract
BackgroundScreening for tuberculosis (TB) infection often includes QuantiFERON-TB Gold Plus (QFT) testing. Previous studies showed that two-thirds of patients with negative QFT results just below the cut-off, so-called borderline test results, nevertheless had other evidence of TB infection. This study aimed to identify a biomarker profile by which borderline QFT results due to TB infection can be distinguished from random test variation.
MethodsQFT supernatants of patients with a borderline (≥0.15 and <0.35 IU·mL−1), low-negative (<0.15 IU·mL−1) or positive (≥0.35 IU·mL−1) QFT result were collected in three hospitals. Bead-based multiplex assays were used to analyse 48 different cytokines, chemokines and growth factors. A prediction model was derived using LASSO regression and applied further to discriminate QFT-positiveMycobacterium tuberculosis-infected patients from borderline QFT patients and QFT-negative patients
ResultsQFT 195名患者的样本收集和安娜lysed. Global testing revealed that the levels of 10 kDa interferon (IFN)-γ-induced protein (IP-10/CXCL10), monokine induced by IFN-γ (MIG/CXCL9) and interleukin-1 receptor antagonist in the antigen-stimulated tubes were each significantly higher in patients with a positive QFT result compared with low-negative QFT individuals (p<0.001). A prediction model based on IP-10 and MIG proved highly accurate in discriminating patients with a positive QFT (TB infection) from uninfected individuals with a low-negative QFT (sensitivity 1.00 (95% CI 0.79–1.00) and specificity 0.95 (95% CI 0.74–1.00)). This same model predicted TB infection in 68% of 87 patients with a borderline QFT result.
ConclusionsThis study was able to classify borderline QFT results as likely infection-related or random. These findings support additional laboratory testing for either IP-10 or MIG following a borderline QFT result for individuals at increased risk of reactivation TB.
Abstract
Additional laboratory testing of IP-10/CXCL10 and MIG/CXCL9 in individuals at increased risk of reactivation TB with a borderline QuantiFERON-TB Gold Plus result just below the formal cut-off helps to identify those withM. tuberculosisinfectionhttps://bit.ly/3t8zR7r
Introduction
Screening for tuberculosis (TB) infection has been recommended in individuals at increased risk of developing reactivation TB [1,2]. In a hospital setting, this predominantly includes patients eligible for monoclonal antibody therapy to treat immune-mediated inflammatory diseases or anti-rejection therapy following transplantation. Immunological tests are frequently employed to diagnose or exclude TB infection, sometimes combined with a chest radiograph [3]. There are two types of immunological tests available: the century-old tuberculin skin test (TST) and the more recently introduced interferon-γ release assay (IGRA) [4,5]. At present there are two commercially available IGRAs: QuantiFERON-TB Gold Plus (QFT; whole blood stimulation followed by ELISA) and T-SPOT.TB (ELISPOT assay on isolated cells). A recent meta-analysis of head-to-head diagnostic accuracy studies estimated that the sensitivity and specificity of T-SPOT.TB and QFT for active TB were 90.2%versus91.4% (sensitivity) and 98.1%versus97.8% (specificity), respectively [6], which was higher than previously reported and, in part, due to the respective study populations [7]. Of note, the accuracy of the QFT appeared to be similar (in head-to-head studies) or even slightly higher (QFT-Plus only) compared with its predecessor (QuantiFERON-TB Gold In-Tube) [6,8].
The interpretation of both IGRA test results differs. Valid T-SPOT.TB test results are classified as negative, borderline or positive, while valid QFT test results are only interpreted dichotomously: either negative or positive [9]. Serial testing of healthcare workers showed that QFT results just above the cut-off value (≥0.35 IU·mL−1) often reverted (became negative) and QFT results just below the cut-off value (<0.35 IU·mL−1) often converted (became positive) [10–12]. For this reason, the implementation of a certain “borderline zone” has been suggested, with the lower limit varying from 0.15 to 0.20 IU·mL−1and the upper limit varying from 0.70 to 0.80 IU·mL−1[12–15]. The proportion of individuals with such a result appears to be affected by the time since exposure toMycobacterium tuberculosisand relevant comorbidities, such as immune-mediated inflammatory diseases, but interestingly not by HIV status [16,17]. Our previous studies demonstrated that nearly two-thirds of patients with a result in the borderline zone below the cut-off had either a positive TST and/or a positive T-SPOT.TB result, suggesting a true infection withM. tuberculosis[18,19].Although a gold standard for diagnosing TB infection does not exist, we aimed to discriminate between infected and uninfected patients with borderline QFT results below the cut-off. This is particularly beneficial for patients who are soon to start biological or pharmacological immunosuppressive therapy, as withholding preventive therapy due to a false-negative QFT result may result in reactivation TB, while initiating preventive treatment in patients with true-negative QFT results may expose patients to potential harmful side-effects of preventive therapy and a delay of the immunosuppressive treatment.
Therefore, the aim of this study was to differentiate between borderline results due to specific T-cell responses toM. tuberculosisor random assay variability. A broad panel of immune markers were measured in QFT supernatant samples of individuals with low-negative, borderline and positive QFT results in order to find a biomarker (profile) that correlates well with the positive test results but is absent in individuals with low-negative (0.15 IU·mL−1) test results.
Methods
The protocol of this study (G19.009) was approved by the local institutional review board (METC-LDD) and the requirement for informed consent was waived. The study aimed to include twice as many individuals with a borderline QFT result as those with a negative or positive QFT result. Considering the slightly varying lower margins of the borderline category below the cut-off (0.20 IU·mL−1being the most prevalent), the borderline limits for this study were set at ≥0.15 and <0.35 IU·mL−1based on findings from two previous studies [19,20].
Sample collection and data retrieval
Residual QFT samples (from the negative control and positive control and two antigen-specific tubes) obtained as part of routine care were collected at three distinct laboratory sites at three different hospitals in the Netherlands: Leiden University Medical Centre (LUMC; Leiden), Haaglanden Medical Centre Westeinde (HMC-W; The Hague) and Alrijne Hospital Leiderdorp (AL; Leiderdorp). At these three hospitals, QFTs were performed during screening for TB infection and sometimes diagnostic work-up for active TB of clinical patients as well as outpatients (often prior to biological treatment). In the defined study period, ∼150 μL blood plasma was isolated from all four QFT tubes in all individuals with a borderline (≥0.15 and <0.35 IU·mL−1) or positive (≥0.35 IU·mL−1量子场论的结果,在每一个第三个人low-negative (<0.15 IU·mL−1)量子场论的结果。随后,所有样品都是商店d at −80°C. At LUMC, samples were collected from July 2019 through November 2020. At AL and HMC-W, samples were collected between May 2020 and November 2020. Initially, all collected samples were included. After assessment of clinical data, which was retrieved between December 2020 and January 2021, we excluded all individuals <18 years of age at the time of testing, as well as those who were diagnosed with active TB. Collected data included sociodemographics, region of origin, reason for testing, bacille Calmette–Guérin (BCG) vaccination status, TST results if available, immune status at the time of testing and relevant comorbidities, such as immune-mediated inflammatory diseases, malignancies and chronic renal failure. Medical records were checked for evidence ofM. tuberculosisinfection (including active TB disease) in November 2021, 12–24 months after collection of the original sample.
Bead-based multiplex assay
All samples were analysed using the Bio-Plex Pro Human Cytokine Screening Panel 48-plex (Bio-Rad, Veenendaal, The Netherlands), which was selected for its broad coverage of relevant inflammatory pathways and included the following 48 cytokines, chemokines and growth factors: β-nerve growth factor (NGF), cutaneous T-cell attracting chemokine (CTACK), fibroblast growth factor (FGF)-basic, eotaxin (CCL11), granulocyte colony-stimulating factor (G-CSF), granulocyte–macrophage CSF (GM-CSF), GRO-α (CXCL1), hepatocyte growth factor (HGF), interferon (IFN)-γ, interleukin (IL)-1β, IL-1 receptor antagonist (ra), IL-1α, IL-2, IL-2ra, IL-3, IL-4, IL-5, IL-6, IL-7, IL-8, IL-9, IFN-α2, IL-10, IL-12 (p40), IL-12 (p70), IL-13, IL-15, IL-16, IL-17A, IL-18, 10 kDa IFN-γ-induced protein (IP-10/CXCL10), leukaemia inhibitory factor (LIF), monocyte chemoattractant protein (MCP)-1, MCP-3, macrophage CSF (M-CSF), macrophage migration inhibitory factor (MIF), monokine induced by IFN-γ (MIG/CXCL9), macrophage inflammatory protein (MIP)-1α, MIP-1β, platelet-derived growth factor (PDGF)-BB, regulated on activation normal T-cell expressed and secreted (RANTES), stem cell factor (SCF), stem cell growth factor (SCGF)-β, stromal cell-derived factor (SDF)-1α, tumour necrosis factor (TNF)-α, TNF-β, TNF-related apoptosis-inducing ligand (TRAIL), and vascular endothelial growth factor (VEGF). The multiplex magnetic bead assay was performed in accordance with the manufacturer's instructions. Subsequent processing was performed as described by VanMeijgaardenet al.[21]. The measured concentration of each biomarker in the unstimulated tube (NIL) was subtracted from that in the stimulated tubes (TB1 and TB2). Only the highest concentration of both stimulated tubes was used for analysis.
Statistical analyses
Statistical analyses were performed using SPSS Statistics version 25 (IBM, Armonk, NY, USA), R version 4.0.3 (R Foundation for Statistical Computing, Vienna, Austria) and Prism 8 (GraphPad, La Jolla, CA, USA). p-values <0.05 were considered statistically significant. Categorical data were analysed and displayed as numerator/denominator to account for missing data.
Linear discriminant analysis (LDA) was conducted in order to separate and classify all samples in low-negative, borderline and positive QFT categories, based on all biomarkers (except for IFN-γ). LDA is a technique which focuses predominantly on the maximalisation of the separability among known categories by maximising the distances (d2) between the means to a central point while minimising the variation (s2在每个类别)。分析是performed using R package “MASS”. For visualisation, R packages “caret” and “tidyverse” were used. Global testing was performed in order to test for pairwise differences in levels between patients with a low-negative, borderline and positive QFT result. All biomarkers were clustered using hierarchical clustering, based on absolute correlation distance and average linkage. Correction for multiple testing was applied using the “inheritance” procedure, which is an adaptation of the Meinshausen method [22]. All procedures were performed using R package “globaltest” version 5.44. LASSO (Least Absolute Shrinkage and Selection Operator) regression analysis wasa priorichosen to construct a simple model enabling discrimination between individuals with a low-negative and positive QFT result based on relevant biomarkers derived from the global test analysis. In order to construct a biomarker signature, data were randomly split into a training set, containing two-thirds of all low-negatives and positives, and a test set, which consisted of the remaining one-third. If the model's predictive accuracy is sufficient it will be used to differentiate patients likely infected withM. tuberculosisfrom those without infection among those with a QFT borderline result. LASSO regression and subsequent receiver operating characteristic (ROC) curves were computed using R packages “glmnet” and “pROC”. A biomarker heatmap was visualised using R package “pheatmap”; correlations were performed using R packages “ggpubr”, “corrplot” and “ggcorrplot”. Cut-offs were determined by calculating the Youden index.
Results
From 210 individuals, supernatants from two stimulated tubes, as well as corresponding positive (mitogen) and negative (NIL) control tubes were collected. Of those, samples from 15 individuals were excluded due to being underage at the time of testing (n=9), active concurrent TB (n=5) or if patient information could not be retrieved from the electronic patient files (n=1). The collected samples from the remaining 195 patients were included in this analysis. Of those, 57 had a low-negative, 87 a borderline and 51 a positive QFT result.
The majority of samples were from LUMC (61.5%). Sociodemographics did not differ between the three hospitals (table 1).In almost two-thirds of our population a QFT was performed during screenings for TB infection, most of which were performed prior to immunosuppressive therapy or transplantation, while in over one-third a QFT was performed due to suspicion of active TB. None of the included individuals had developed reactivation TB after a 1- to 2-year follow-up, despite immune-modulating therapy in many.
所有包括pati的特征ents
Discriminating groups using LDA
LDA was performed using data for all biomarkers (with omittance of IFN-γ) measured in theM. tuberculosisantigen-stimulated tubes corrected for background (NIL tubes) to investigate whether biomarkers other than IFN-γ were able to discriminate samples of patients with low-negative, borderline and positive QFT results. The plot infigure 1shows obvious grouping according to these 47 biomarkers. Patients with a positive QFT result were clearly separated from those with a low-negative QFT result. However, the plot also shows that patients with a borderline QFT result were often classified as either low-negative or positive, highlighting the diversity of this specific group. As a result, the prediction accuracy of the model was only 66.7%.
Classification of all samples using linear discriminant analysis (LDA). QuantiFERON-TB Gold Plus results distinguished by LDA, including all cytokines (except for interferon-γ), chemokines and growth factors. All data were log2-transformed prior to analysis. Includes all data.
Identification of biomarkers for TB infection
A heatmap with an overview of all biomarker levels is displayed insupplementary figure S1. All TB1 biomarkers correlated strongly with their counterparts measured in the TB2 tubes, except for IL-15 in the low-negative category and IL-3 among those with a positive QFT result (supplementary figure S2a–d).Global test analysis was performed on all biomarkers (with omittance of IFN-γ) measured in the TB-specific tubes (corrected for NIL) in order to construct a more precise profile associated with TB infection. After correction for multiple testing, this analysis revealed three biomarkers that were significantly higher in patients with TB infection (based on a positive QFT result) compared with individuals with a low-negative QFT result (IP-10, MIG and IL-1ra; p<0.001) (figure 2).Among those with either a positive or low-negative QFT result, ROC analysis revealed that both MIG (area under the curve (AUC) 0.98, 95% CI 0.96–1.00; cut-off 1176 pg·mL−1) and IP-10 (AUC 0.95, 95% CI 0.91–0.99; cut-off 861 pg·mL−1) (supplementary figures S3a and b) were highly accurate for TB infection (based on a positive QFT result), while the accuracy of IL-1ra was moderate (AUC 0.78, 95% CI 0.70–0.87; cut-off 3444 pg·mL−1) (supplementary figure S3c).The relationship between these three biomarkers using Spearman's correlation coefficient revealed that IP-10 and MIG were strongly correlated (R=0.88, p<0.001) (figure 3a).As expected, the correlations between IL-1ra and both IP-10 and MIG were significant but moderate (R=0.41, p<0.001 and R=0.43, p<0.001, respectively) (figure 3band c).
Comparison of biomarker levels between positiveversuslow-negative QuantiFERON-TB Gold Plus (QFT) samples. A pairwise comparison of all cytokines, chemokines and growth factors between positive and low-negative QFT samples was conducted using global test analysis. The absolute correlation between biomarkers is depicted using hierarchal clustering. Uncorrected p-values are depicted on the left of the bar chart. Black lines on the clustering graph indicate significant multiplicity corrected p-values, while nonsignificant p-values are depicted with grey lines. Includes all data. See the bead-based multiplex assay section of the Methods for details of biomarkers included in the Bio-Plex Pro Human Cytokine Screening Panel.
Correlation between 10 kDa interferon (IFN)-γ-induced protein (IP-10), monokine induced by IFN-γ (MIG) and interleukin-1 receptor antagonist (IL-1ra). A positive correlation between a) IP-10 and MIG, b) IP-10 and IL-1ra, and c) MIG and IL-1ra was measured by Spearman's correlation coefficient and two-tailed p-value analysis. All data were log2-transformed prior to analysis. Includes all data.
Development of a prediction model for TB infection
The discriminatory biomarkers IP-10, MIG and IL-1ra were subsequently used in a LASSO regression model to obtain a biomarker signature that was able to distinguish patients with TB infection, based on a positive QFT result, from uninfected individuals, based on a low-negative QFT result (training data) (figure 4a).The classifying capacity of this biomarker profile was validated and displayed as a ROC curve (test data) (figure 4b), which yielded an AUC of 0.97 (95% CI 0.92–1.00). Corresponding sensitivity and specificity were high: 1.00 (95% CI 0.79–1.00) and 0.95 (95% CI 0.74–1.00), respectively. Adding biomarkers that were significant without correction did not improve the classifying capability of the biomarker signature. Of note, the model assigned “TB infection” to all patients who were excluded due to microbiologically proven active TB (n=5) (supplementary table S1).
Accuracy of the biomarker signature. a) Biomarker signature derived from LASSO regression analysis based on patients with a positive QuantiFERON-TB Gold Plus (QFT)versuslow-negative QFT result. Includes only training data. b, c) Receiver operating characteristic curve plots showing the prediction accuracy of the model allowing discrimination b) between patients with tuberculosis (TB) infection (based on a positive QFT result) and without TB infection (based on a low-negative QFT result) and c) between patients with a borderline QFT result and subjects without TB infection (based on a low-negative QFT result). Includes only test data. MIG: monokine induced by interferon (IFN)-γ; IP-10: 10 kDa IFN-γ-induced protein; IL-1ra: interleukin-1 receptor antagonist; AUC: area under the curve.
Prediction model applied to borderline results
Subsequently, the same regression model, which successfully discriminated between patients with TB infection and uninfected individuals, was used to further characterise individuals with a borderline QFT result. Among patients with a borderline QFT result, 59 out of 87 (67.8%) were positive and thus likely to have TB infection (figure 4c).Of the three patients with a low-negative QFT result who were classified as TB-infected in the model, one had a QFT result of 0.14 IU·mL−1in association with a TST induration of 10 mm, one received glucocorticoids during testing and one was not tested with the TST.
The characteristics of those 59 patients with a borderline QFT result of whom the model predicted to have TB infection (TB infection profile+) were compared with the 28 patients with a borderline QFT result in whom the model predicted to be uninfected (TB infection profile−) (table 2).Borderline TB infection profile+ individuals did not differ significantly from TB infection profile− individuals regarding clinical characteristics. Although mean TST values were higher among TB infection profile+ individuals, median TST and QFT values did not differ significantly from TB infection profile− individuals. Findings on chest radiography possibly suggestive of prior TB infection were scarce and did not significantly differ among groups (table 2).After Bonferroni adjustment for multiple testing, no significant differences were noted between biomarker values with respect to TB endemicity, immunosuppressive therapy and autoimmune diseases (supplementary tables S2–S4).
Characteristics by QuantiFERON-TB Gold Plus (QFT) result and biomarker profile
Classification of borderline results based on individual biomarker cut-offs
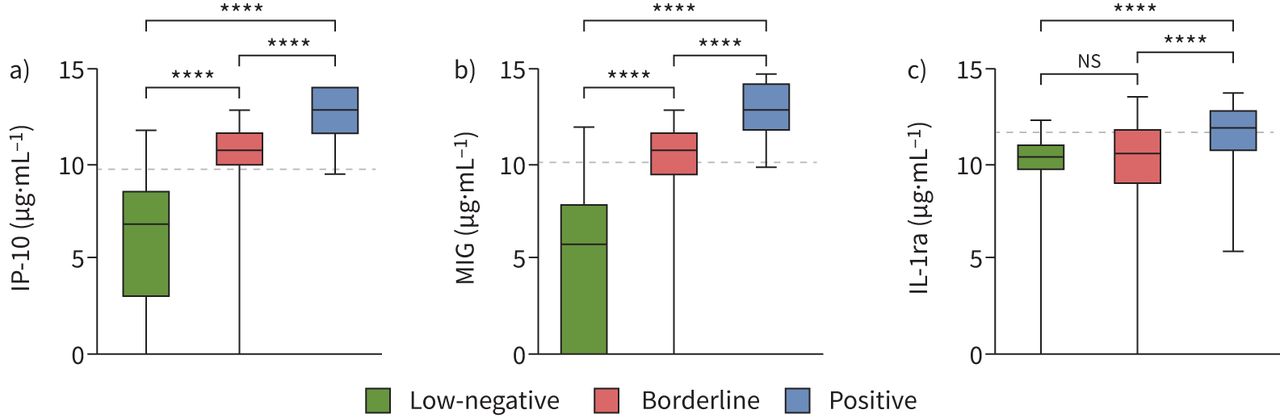
Median levels of IP-10 and MIG differed significantly between individuals with a low-negative, borderline or positive QFT result (p<0.001) (figure 5), while levels of IL-1ra were similar among those with a low-negative and borderline QFT result. Of note, specific focus on the low-positive QFT results (n=12; ≥0.35 and <0.70 IU·mL−1) revealed a similar quantitative relation between QFT results and IP-10/MIG values (supplementary figure S4).An additional analysis of borderline QFT results, independent of the prediction model, was performed based on the individual cut-offs of IP-10 and MIG combined; cut-offs were determined based on the optimal sensitivity and specificity combination in ROC curves as described forsupplementary figure S3(figure 6).分析表明,54 87 (62%)of all individuals with a borderline result had both IP-10 and MIG levels above the cut-offs designated for TB infection. In addition, all 54 individuals were predicted to have TB infection by our previous model.

Biomarker values by QuantiFERON-TB Gold Plus categories: a) 10 kDa interferon (IFN)-γ-induced protein (IP-10), b) monokine induced by IFN-γ (MIG) and c) interleukin-1 receptor antagonist (IL-1ra). Biomarker values (medians and quartiles) are displayed as boxes, with whiskers representing 5–95% percentiles. Significant differences between groups were calculated using the Mann–Whitney U-test. Dashed lines represent the optimal cut-off (Youden index) derived from receiver operating characteristic curves (supplementary figure S3).All data were log2-transformed prior to analysis. Includes all data. ****: p<0.0001;ns: nonsignificant.
10 kDa interferon (IFN)-γ-induced protein (IP-10) and monokine induced by IFN-γ (MIG) levels among borderline QuantiFERON-TB Gold Plus (QFT) samples. IP-10 and MIG levels of all 87 patients with a borderline QFT result. Dashed lines represent the optimal cut-offs (Youden index) derived from receiver operating characteristic curves (supplementary figure S3).All data were log2-transformed prior to analysis. Includes all data.
Discussion
After analysing a broad set of cytokines, chemokines and growth factors, we identified three biomarkers (IP-10, MIG and IL-1ra) inM. tuberculosis特殊技能antigen-stimulated QFT管可能discriminate patients with TB infection from likely uninfected individuals, in addition to the universally used biomarker IFN-γ. Subsequent LASSO regression analysis created a simple prediction model, including only MIG and IP-10. Application of this model on patients with low-negative and positive QFT results revealed that it was highly accurate in both detecting and “excluding” TB infection. Among patients with a borderline QFT result, this model predicted that nearly two-thirds of all patients with a borderline QFT result were likelyM. tuberculosisinfected, corroborated by combined MIG/IP-10 positivity independent of the model, which is in accordance with the previously reported proportion of infected individuals among those with a borderline QFT result [18,19].
All of the biomarkers in our model are involved in the host's defence against an infection withM. tuberculosis. During infection, IP-10 attracts T-helper type 1 cells to the site of inflammation where it binds a receptor shared with MIG: CXCR3 [23,24]. CXCR3 is an important receptor in mediating both innate and adaptive immune responses [24]. CXCR3-expressing T-cells were found in the lungs of infected mice, as well as in necrotic granulomas in nonhuman primate models [25,26]. Absence of IP-10 increasesM. tuberculosisbacillary growthin vitro[27]. The role of MIG during infection is similar to that of IP-10 [24]. However, the secretion of IP-10 is stimulated by more cytokines than just IFN-γ, whereas the secretion of MIG almost exclusively depends on IFN-γ [28]. Thus, IP-10 and MIG appear to have a fundamental role in the formation of granulomas and subsequent host defence againstM. tuberculosis. Of note, IL-1ra inhibits the pro-inflammatory cytokine IL-1 and has been hypothesised to be an integral, self-limiting feature of alveolar macrophages [28,29]. Unlike IP-10 and MIG, the secretion of IL-1ra is not directly stimulated by IFN-γ.
Both IP-10 and MIG have been shown to be accurate alternatives for IFN-γ in diagnosing or excluding TB infection in several previous studies [30,31]. A recent systematic review and meta-analysis found a good sensitivity (85%) and moderate specificity (63%) of IP-10 in regular blood collection tubes for culture-positive active TB [32]. Among individuals with TB infection (based on a positive TST or QFT result), pooled sensitivity and specificity were 85% and 89%, respectively [33]. MIG levels are also high in patients with TB. A systematic review and meta-analysis on the predictive accuracy of MIG in antigen-stimulated and unstimulated supernatants among patients with culture-positive TB found that pooled sensitivity and specificity were both 84% [34]. A prior study investigated the diagnostic accuracy of IP-10/MIG values for TB infection in antigen-stimulated QFT tubes derived from healthcare workers classified as those without TB infection (defined by a QFT result <0.1 IU·mL−1and TST result <10 mm), undetermined TB infection (defined by a QFT result ≥0.1 and <0.35 IU·mL−1and/or a TST >10 mm) and with TB infection (QFT result ≥0.35 IU·mL−1) [35]. They found that a combined two-by-two cut-off (derived from individual ROC curves) of both IP-10 and MIG resulted in an increased specificity of 88%, while sensitivity for TB infection remained 100% in the group with undetermined TB infection, which is similar to our findings. Recently, a study in pregnant women with a borderline QFT result in Ethiopia found that 41% of these women had a high likelihood of TB infection based on ak-nearest neighbour analysis [36]. However, this percentage included predominantly patients with a borderline QFT result above the cut-off (up to 0.70 IU·mL−1), while our study included only borderline QFT results below the cut-off. The diagnostic accuracy of IL-1ra forM. tuberculosisinfection has not yet been studied.
The predicted percentage (68%) ofM. tuberculosis-infected patients despite a QFT result just below the cut-off is corroborated by estimations in our previous studies. We first found that borderline QFT results occurred in three-fold excess over random test variability [19]; the second study corroborated the latter and found a positive TST and/or T-SPOT.TB result in two-thirds of all patients with a borderline QFT result [18].
这项研究是缺乏的关键限制ld diagnostic standard for TB infection, which is inherent to the subject of study. Our reference group for TB infection consisted of individuals with a positive QFT result, while individuals with a low-negative QFT result were assumed uninfected. During validation, the model predicted three out of 19 patients with a low-negative QFT result to be likely infected. Interestingly, one of the three had been exposed to someone with active TB and had a positive TST result, highlighting the strength of the model in identifying possible false-negative QFT results. A second key limitation encompasses the lack of an independent validation cohort with low TB risk individuals with a low-negative QFT result for the most ideal assessment of the model's (already high) specificity. However, only eight subjects with a low-negative QFT result originated from a TB endemic area and none developed reactivation TB during follow-up. However, more data are needed to evaluate the use of these biomarkers in individuals with a low-negative QFT result. A strength of our study is that it included patient samples from three distinct laboratory sites at three different hospitals, which resulted in a heterogenous cohort. Our population itself was another strength of this study because it included patients with autoimmune diseases and immunosuppressive therapy, making our findings more likely to be clinical useful, as our targeted population (those at increased risk of reactivation) often includes patients with such conditions. Also, the accuracy of IP-10 and MIG as individual biomarkers for TB infection was high, likely increasing the concomitant accuracy of our model, including for borderline QFT positives. Our prediction model attributes a relatively small coefficient to IP-10 compared with that of MIG. However, this is most likely due to the intrinsic aspects of the LASSO regression method. In case of collinearity, LASSO tends to assign a relatively low coefficient to one variable, in this case IP-10. However, our study clearly showed that IP-10 was strongly correlated with MIG and thus, according to our model, likely a good predictor for responses as well (figures 3aand 4a and b). Our results show that European Unionin vitrodiagnostic medical device regulation IVDR 2017/746-compliant IP-10 and/or MIG assays are urgently needed. Currently, there are twoin vitrotests under development using IP-10 as a readout, one based on ELISA and one based on a lateral flow assay (IP-10 IGRA LF), both of which are developed by R-Biopharm (Darmstadt, Germany) [37,38]. In light of the several aforementioned studies that proved high diagnostic accuracy of IP-10 for TB infection and our findings, such an IP-10-based assay could be a useful tool to increase the diagnostic sensitivity for TB infection, in particular among those with a borderline QFT result. These findings, if corroborated by different studies (e.g.conducted in TB endemic countries), may also encourage the QFT's manufacturer to include a second biomarker, IP-10/MIG, as a readout for a future QFT test.
The clinical relevance of these findings for an individual depends on the assumed risk of progression to active TB. For example, during occupational screening of healthcare workers in low TB endemic areas, the benefits of preventive treatment for those with a borderline QFT result do not outweigh the harm of potential side-effects. In contrast, targeted preventive treatment of patients eligible for treatment with immunosuppressive agents who have a borderline QFT result and IP-10 or MIG response will reduce the risk of reactivation TB significantly without exposing uninfected patients to drug toxicity or interactions and delayed start of their immunosuppressive treatment. If our results can be corroborated in a larger cohort, additional measurement of IP-10 and/or MIG in QFT supernatants may well be able to refine clinical decision making by increasing diagnostic accuracy in the borderline QFT-zone.
Supplementary material
Supplementary Material
Please note:supplementary material is not edited by the Editorial Office, and is uploaded as it has been supplied by the author.
Supplementary materialERJ-02665-2021.SUPPLEMENT
Shareable PDF
Supplementary Material
This one-page PDF can be shared freely online.
Shareable PDFERJ-02665-2021.Shareable
Footnotes
Conflict of interest: T.H.M. Ottenhoff reports grants from NWO-TTW (PI: T.H.M. Ottenhoff), Dutch Government, Technical Sciences; ZonMw (PI: T.H.M. Ottenhoff), Dutch Government (ZonMw); IMI2 HOR2020 VSV EBOPLUS (PI: C.A. Siegrist), European Commission HOR2020 IMI2 Program; NWO-TTW (PI: J. Bouwstra), Dutch Government, Technical Sciences; NWO-TTW (PI: T.H.M. Ottenhoff), Dutch Government, Technical Sciences, NACTAR Program; NWO-Chemical Sciences (PI: A. Minnaard), Dutch Government, Technical Sciences; EC HOR2020 TRANSVAC2 (PI: European Vaccine Initiative (EVI)), European Commission HOR2020 Program; IMI2 EC HOR2020 Respiri-TB (PI: M. Lamers), European Commission HOR2020 IMI2 Program; IMI2 EC HOR2020 Respiri-NTM (PI: M. Lamers), European Commission HOR2020 IMI2 Program; NIH (PI: T.H.M. Ottenhoff); NIH, NIAID, grant: 1RO1AI141315-01A1; EC HOR2020 SMA-TB (PI: C. Vilaplana); European Commission HOR2020 Program; leadership at the Tuberculosis Vaccine Initiative (TBVI;www.tbvi.eu); outside the submitted work. S.A. Joosten reports grants from NIH (PI: T.H.M. Ottenhoff; co-PI: S.A. Joosten); NIH, NIAID, grant: 1RO1AI141315-01A1; outside the submitted work. S.M. Arend reports travel support from Oxford Immunotec, outside the submitted work. All other authors have nothing to disclose.
支持声明:这项工作是支持的European Commission Horizon 2020 research project TBVAC2020 consortium (number 643381 to T.H.M. Ottenhoff). The text represents the authors’ views and does not necessarily represent a position of the Commission who will not be liable for the use made of such information. Funding information for this article has been deposited with theCrossref Funder Registry.
This article has an editorial commentary:https://doi.org/10.1183/13993003.00697-2022
- ReceivedOctober 8, 2021.
- AcceptedDecember 18, 2021.
- Copyright ©The authors 2022.
This version is distributed under the terms of the Creative Commons Attribution Non-Commercial Licence 4.0. For commercial reproduction rights and permissions contactpermissions{at}ersnet.org
References